Findings
Our study was the first large controlled trial of an educational intervention designed for children with Down syndrome, and one of the largest of any study of children with Down syndrome to date. Here, we summarise our findings.
At the start of the trial, the two groups of children in our study did not differ significantly on any of the language and literacy measures. At the end of the RCT phase (A), we examined whether differences had emerged between the groups.
Effects of intervention
Our first analysis looks at the effects of intervention during the RCT phase (A) of the study where one group of children received the intervention and the other group received ordinary teaching.
Figure 1 illustrates the differences between the two groups at the end of the first 20-week phase (A) during which one group received the reading and language intervention and one group received 'teaching as usual'. Each column represents the difference between the initial intervention and the waiting control groups at the end of this period, with a positive result representing a relative gain for the intervention group. (See also Data Tables 1 to 4.)
On most measures, the group receiving the intervention made noticeably more progress than the group receiving 'teaching as usual'. These gains on different measures varied with very small differences observed on some and larger differences on others.
Effects of intervention
- On most measures, the group receiving the intervention made noticeably more progress than the group receiving 'teaching as usual'.
- The differences on four outcome measures were statistically significant: single word reading, letter-sound knowledge, phoneme blending and taught expressive vocabulary.
- These four measures reflect the skills that were most directly taught by the intervention.
The vertical lines represent the range within which it is 95% certain the 'true' average gain lies. Therefore, where the vertical lines do not drop below the zero gain level, we consider the effect to be statistically significant (p < .05).
The differences on four outcome measures were statistically significant: single word reading, letter-sound knowledge, phoneme blending and taught expressive vocabulary. These are therefore the gains that we can be most confident are not due to chance. These four measures reflect the skills that were most directly taught by the intervention.
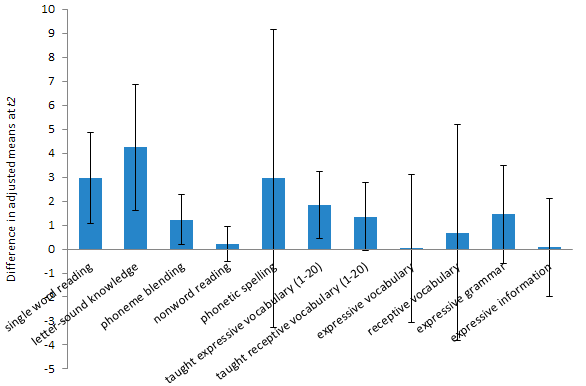
Figure 1 | Relative gains for intervention group compared to the control group after 20 weeks.
Reading progress
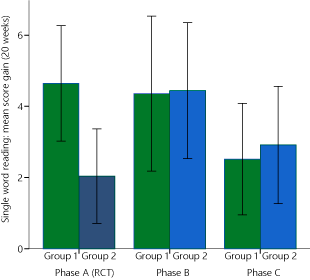
Figure 2 | Gains in single word reading scores during three study phases for both groups.
In typical development, word reading accuracy is said to depend on two critical foundational skills: letter sound knowledge (understanding how sounds are represented by letters) and phoneme awareness (awareness of the fact that spoken words are made up of smaller units of sounds - phonemes). Both of these skills were measured in our trial.
The test of letter knowledge assessed children's knowledge of the sounds represented by 26 letters and 6 digraphs (2 letters representing one sound e.g. sh). Phoneme awareness was assessed by a test of phoneme blending. Here, the assessor sounds out the letters ' b-e-d ' in a robot voice and the child is asked to choose the picture that represents the target word from 3 pictures (bed, bud and head - you can see the other words are chosen to make sure the child is getting the word correct).
Single word reading is the most direct measure of reading progress. It measures a child's ability to read words from a list that increases in difficulty. Children could read these words correctly either from sight (from memory) or by working them out using the underlying skills of letter-sound knowledge and phoneme awareness (the basis of phonics): identifying the sound for every letter in a word, then blending these sounds together to form the word. A pure test of using this phonic approach to reading comes from asking children to read nonwords - made up words children have not seen before. In our study, we used a simple test, asking children to read the names of 6 cartoon monsters: et, om, ip, neg, sab and hic. As children become more able to sound out unfamiliar words to decode them, their reading progress accelerates. Finally, spelling ability was also assessed.
Reading progress
- Over 20 weeks, the mean average gain on the single word reading measure for children in the intervention group was 4.6 and this compares to 2.0 for the control group.
- The median gain on the single word reading measure for children in the intervention group was 3.0 and 1.0 for the control group.
The study found that the relative gains for children in the intervention group were statistically significant (i.e. unlikely due to chance) on a number of measures: letter sound knowledge and phoneme blending (skills directly taught by the intervention) and single word reading. After 20 weeks, there were only small gains on nonword reading and spelling and these differences were not statistically significant.
Most of these children were at the very early stages of learning about words and sounds and how sounds work in words in this first phase of the study. It is therefore not surprising that the gains on the easier letter sound and phoneme blending tasks did not transfer to the more difficult nonword and spelling tasks at this point in time. Previous research has highlighted that children with Down syndrome have more difficulty mastering phonics skills and using them to decode than they do developing sight word reading skills.
The mean average gain on the single word reading measure for children in the intervention group was 4.6 and this compares to 2.0 for the control group. In other words, the intervention group were, on average, able to read an additional 2.6 words out of those presented in a graded single word reading test (one where the words presented get progressively more difficult) during 20 weeks of intervention, compared to the control group. The median gain on the single word reading measure for children in the intervention group was 3.0 and 1.0 for the control group (Table 1).
| RCT Phase (A) | Supported (B) | Independent (C) | ||||
|---|---|---|---|---|---|---|
| Group 1 | Group 2 | Group 1 | Group 2 | Group 1 | Group 2 | |
| Mean score gain | 4.64 | 2.04 | 4.36 | 4.44 | 2.52 | 2.92 |
| Median score gain | 3.0 | 1.0 | 3.0 | 3.0 | 2.0 | 2.0 |
| Standard Deviation | 4.18 | 3.21 | 5.61 | 4.63 | 3.97 | 3.90 |
| Minimum score gain | 0 | -1 | -4 | -1 | -2 | -2 |
| Maximum score gain | 15 | 11 | 21 | 15 | 15 | 12 |
At the beginning of the study, 12 out of 28 children (43%) in the intervention group and 9 out of 25 children (36%) in the control group scored zero on the single word reading test. After 20 weeks of intervention, 11 of these 12 children in the intervention group were able to score on the test, leaving 1 child (4%) in the intervention group continuing to score zero, compared to 7 children (28%) in the control group still scoring zero.
Language progress
The measures we used to assess language skills were firstly assessments designed to find out if the children could say (taught expressive vocabulary) or understand (taught receptive vocabulary) more of the words actually taught in the language strand activities. We detected differences on both of these measures favouring the intervention group and the difference on taught expressive vocabulary was statistically significant.
We also assessed the children's language progress using standardised tests of expressive and receptive vocabulary designed to measure progress in typically developing children. We did not detect significant differences between the groups on these measures, nor on measures of expressive grammar or information after 20 weeks of intervention.
Gains for group 2 moving to supported intervention (phase B)
Group 2 receiving intervention
- Progress on the word reading measure for group 2 accelerated from an average of 2.04 on 'teaching-as-usual' to 4.44 on intervention (compared to 4.64 for the original intervention group 1).
- Most children progressed faster with their word reading on the intervention: 16 out of 25 (64%) made greater gains.
In the second phase (B), the group that had received 'teaching-as-usual' in the RCT phase (A) went on to receive the intervention. Compared to how they progressed while receiving 'teaching-as-usual' during the control period, group 2 made greater gains on many measures when receiving the intervention (Data Table 3). Only the gains in word reading progress were statistically significant.
Several of these gains were similar to the relative gains achieved by the first intervention group. Progress on the word reading measure for group 2 accelerated from an average of 2.04 on 'teaching-as-usual' to 4.44 on intervention (compared to 4.64 for the original intervention group 1; Figure 2). The median gain on the single word reading measure for children in group 2 when receiving the intervention was 3.0 and 1.0 when receiving 'teaching as usual' (Table 1).
In this group, most children progressed faster with their word reading on the intervention: 16 out of 25 (64%) made greater gains, 4 (16%) progressed at same rate, 3 (12%) made smaller gains and scores fell by one word for 2 (8%).
Continued progress for group 1 in second 20 weeks of supported intervention (phase B)
During the second phase (B), the original intervention group continued to receive the intervention and Teaching Assistants continued to receive support from the research team. Compared to their initial 20 weeks of intervention, the children continued to make similar rates of progress on many measures (Data Table 5). Gains on measures of phonic skills varied and some of these gains were hard to interpret because some individual children were getting scores near to ceiling on some measures such as letter sound knowledge and phoneme blending.
The rate of progress on the word reading measure for group 1 in their second 20 weeks of intervention remained similar to that in the first 20 weeks (4.36 compared to 4.64; Figure 2 and Data Table 5). The median gain on the single word reading measure for children in group 1 during their second 20 weeks of intervention remained at 3.0 (Table 1).
Slower rates of progress during independent intervention phase (C)
In the final phase (C) of the study, the schools were asked to continue the intervention, but without regular calls and termly visits from the research team. Rates of progress on some measures slowed during this phase, including gains achieved on word reading (Figure 2, Table 1, Data Table 7).
Although average gains achieved on word reading during the independent intervention phase were less than those achieved during the supported intervention phases, many children continued to make progress. During the independent intervention phase, 34 of 51 children (67%) continued to gain more words on the measure, 7 children (14%) maintained their word reading scores, while 6 children (12%) scored 1 less word and 4 children (8%) scored 2 less words.
A number of factors may have contributed to this. Fewer intervention sessions were provided during this phase: the average number of intervention sessions fell from 69 in Phase B to 54 in Phase C (out of a maximum of 100 sessions). During phase C, group 1 was not provided with prepared language teaching session plans and materials, having completed the resources prepared for 40-weeks of teaching. (Group 2 moved to the second block of prepared language teaching materials during this phase).
Also, at this stage in the study some of the children had progressed far enough with their reading for the intervention to no longer be suitable for them. At the beginning of this phase of the study, 13% were scoring at levels equivalent to typical reading ages of 92 months or higher on the word reading measure.
Finally, teaching staff were aware by this point that the study was drawing to a close and may have been less motivated than they were in the earlier phases. For teaching assistants in group 1, delivering the intervention required more work (creating language teaching resources) during this phase. This would be consistent with the observed reduction in intervention sessions delivered. Unfortunately, we did not collect more detailed information about exactly what was being taught during the sessions. For example, it might have been the case that some teaching assistants in group 1 delivered intervention sessions without including language strand components.
We are therefore unable to draw firm conclusions as to why rates of word reading progress slowed during the independent intervention phase, compared to the progress observed on supported intervention. These observations do, however, raise concerns about the need for effective support for teaching assistants delivering the intervention. DSE is therefore working to ensure high quality information and support is available through the Teacher's Handbook, video training materials, online courses and the development of local support networks.
Other findings
Not all the progress that we or the children's teachers, speech and language therapists and parents observed was captured on the standardised assessments. Small steps in daily progress on the teaching activities may not be large enough to transfer to gains on standardised tests within a 20 week period.
Noticeable improvements in the use of spoken language were reported for some children who did not make measurable reading gains. A number of schools reported that the structure of the interventions - always the same set of activities in the same order, small steps, fast paced - led to improved behaviour, attention and engagement in learning. In some cases, staff felt this transferred to other lessons and that seeing the child's progress in the intervention sessions raised expectations for what this child might achieve. It also gave staff ideas for structuring other lessons more successfully.
For further information about the views of Teaching Assistants and parents, please refer to the qualitative feedback collected during the study.
Individual differences and response to intervention
The discussion of intervention effects above compares the average progress of the children in each group. Within each group, there were notable differences between individual children and the rates of progress that they each made in each phase of the study.
Factors predicting progress with word reading
Factors influencing progress
- Children whose word reading skills progressed the most were those children who were younger, children who had better receptive language skills at the start of the intervention, and children who attended more intervention sessions.
We examined a variety of possible factors that previous research suggested might lead to the differences in individual rates of progress that we had observed: age, gender, behaviour, non-verbal IQ (intelligence), phoneme blending skills, letter-sound knowledge, language skills (a combined measure of ability to understand spoken vocabulary and grammar), number of intervention sessions attended, and the effectiveness of the Teaching Assistant. For each child, we created a measure of their reading growth (how much progress they made on the reading test during the first 40 weeks of the study, adjusted for how many words they could read before the intervention began). We then examined whether any of the possible influencing factors were related to reading growth.
Interestingly, hearing loss (as reported by parents) was not found to influence rates of progress with word reading. This may suggest a benefit from individualised teaching in quiet rooms, or reflect improving clinical treatments for children with detected hearing loss. Neither was gender found to influence rates of progress with word reading.
We found that three of these factors were significantly and independently related to progress: age, receptive language and the number of sessions attended. In other words, the children whose word reading skills progressed the most were those children who were younger, children who had better receptive language skills at the start of the intervention, and children who attended more intervention sessions.
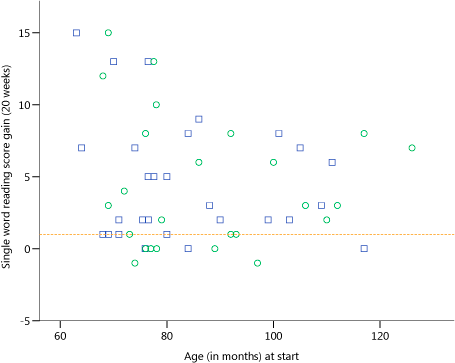
Figure 3 | Single word reading score gains over 20 weeks of supported intervention related to age at the start of the intervention period. (First 20 weeks of intervention for each group. Blue squares indicate children in group 1. Green circles indicate children in group 2. Dotted horizontal line shows median score gain for control group receiving 'teaching as usual'.)
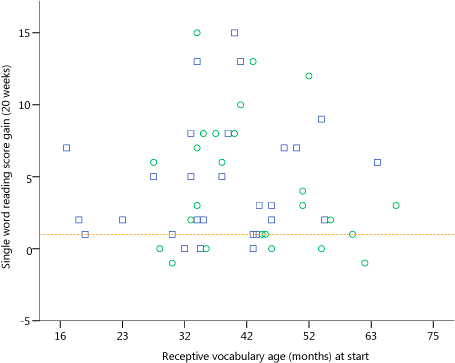
Figure 4 | Single word reading score gains over 20 weeks of supported intervention related to receptive vocabulary at the start of the intervention period. (First 20 weeks of intervention for each group. Blue squares indicate children in group 1. Green circles indicate children in group 2. Dotted horizontal line shows median score gain for control group receiving 'teaching as usual'.)
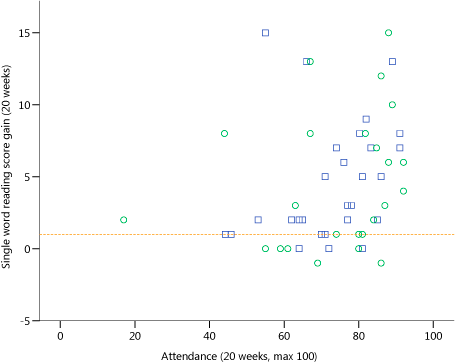
Figure 5 | Single word reading score gains over 20 weeks of supported intervention related to intervention sessions attended during the intervention period. (First 20 weeks of intervention for each group. Blue squares indicate children in group 1. Green circles indicate children in group 2. Dotted horizontal line shows median score gain for control group receiving 'teaching as usual'.)
To explore the practical significance of these three factors we can look at individual score gains in relation to age, receptive language abilities and the number of intervention sessions received during the first 20 weeks of intervention received by both groups.
Age
Figure 3 shows the gain in word reading scores achieved by the children in the study during their first 20 weeks on the intervention plotted against their age at the start of their intervention period. Both groups are included. The gain in scores for the initial intervention group (1) during the first 20 week period and the gain in scores for group 2 in the second 20 week period (when they first received the intervention) are shown. The median score gain observed for the control group during the initial 20 weeks of 'teaching as usual' is shown as a dotted horizontal line.
This illustrates that the children who made the greatest gains were aged between 60 and 80 months at the start of the 20 week intervention period. It also illustrates that not all of the younger children made such large gains and that many of the older children made good progress.
This suggests that children with Down syndrome should have the opportunity to receive reading instruction in school from 5 years of age, at the same time as their peers despite their usual language and cognitive delays, though rates of progress will vary. It also shows that the fact that younger children in general do better should not be interpreted to imply that older children cannot benefit from the intervention.
Language skills
Figure 4 illustrates the relationship between receptive language levels and changes in word reading scores in a similar way.
The children who achieve the highest gains during the 20 weeks tend to have receptive vocabulary ages above 23 months but 1 of the 4 children with a lower score made a gain of 7 words. Also, not all of the children who began the intervention period with better receptive language skills achieve more than the median score gain for 'teaching as usual' and some made no progress.
While receptive language levels may guide expectations, this suggests that a wide range of children with Down syndrome can benefit from the intervention, including some who are only at the early stages of understanding spoken language.
Number of sessions received
Similarly, Figure 5 illustrates the relationship between changes in word reading scores and the number of teaching sessions received during the intervention period. This shows that the children who received more than 60 sessions made the greatest gains and that most of the children who received 80 sessions or more made better progress on the intervention than 'teaching as usual'.
We need to interpret this finding with a degree of caution as there could be a number of reasons for a child not receiving all or most of the intervention sessions. It is possible that children with health problems or who were making slower progress or were harder to teach received fewer lessons.
However, many children with Down syndrome will require consistent, high quality teaching over a substantial period of time to make good progress and educators should avoid 'giving up' with children who appear to be making little or no progress.
Children who made little or no progress
| Case | Group | Age at start (months) | Receptive Vocabulary Raw Score (at start) | Expressive Vocabulary Raw Score (at start) | Block Design Raw Score (at start) | Attendance (% of max. possible) | Behaviour Rating (1=Good, 5=Poor) |
|---|---|---|---|---|---|---|---|
| 1 | 1 | 117 | 41 | 28 | 12 | 57% | 1.0 |
| 2 | 1 | 80 | 41 | 16 | 19 | 54% | 1.3 |
| 3 | 2 | 68 | 18 | 13 | 5 | 44% | 1.7 |
| 4 | 2 | 70 | 13 | 9 | 0 | 84% | 4.3 |
| 5 | 2 | 70 | 12 | 10 | 0 | 56% | 3.4 |
| 6 | 2 | 83 | 32 | 21 | 11 | 61% | 2.4 |
| 7 | 2 | 62 | 26 | 18 | 4 | 48% | 1.3 |
| 8 | 2 | 85 | 32 | 27 | 12 | 77% | 1.3 |
| Mean | 82 | 35 | 29 | 13 | 65% | 1.6 | |
During the study, some children made very little progress with word reading. At the end of the study, 8 out of 51 children (16%; 4 boys) were unable to score or scored only 1 word on this measure, while 43 children (84%) scored 4 words or more and 50% of children scored 10 words or more.
Of these 8 children who made little progress on word reading, 2 were in the initial intervention group (1) and had therefore received the intervention for a total of 21 months (2 out of 27; 7%). The remaining 6 children were in the initial waiting control group (2) and had therefore received the intervention for 40 weeks (6 out of 24; 25%).
Some of the children who made little or no progress were older and some were younger than the average for all children (Table 2). Some had better language skills, while some had poorer language skills, and behaviour ratings varied.
Three younger children with poorer language skills and low non-verbal ability (cases 3, 4 and 5), two of whom had high problem behaviour ratings (cases 4 and 5) are among those making little or no progress. This may suggest that children sharing a similar profile may make little progress on the intervention. However, one child of a similar age with similar language and non-verbal abilities did make progress with word reading on the intervention.
For the other five children, it is not clear what initial measures could have predicted their lack of progress on word reading over 21 months.
Our study included all children with Down syndrome whose parents and schools in the study areas agreed to participate. It is not known if some children with Down syndrome experience particular difficulties with reading: it is possible that there is a sub-group for whom reading is significantly more difficult.
| Measure (Maximum Score Possible) | Mean Score Gain | Median Score Gain | Minimum Score Gain | Maximum Score Gain | No Progress |
|---|---|---|---|---|---|
| Single word reading (79) | 10.61 | 8.0 | 0.0 | 42.0 | 12% |
| Letter-sound knowledge (32) | 9.17 | 9.0 | -3.0 | 26.0 | 14% |
| Phoneme blending (10) | 1.47 | 1.0 | -4.0 | 9.0 | 42% |
| Nonword reading (6) | 1.18 | 1.0 | -3.0 | 6.0 | 49% |
| Phonetic spelling (92) | 22.04 | 0.0 | -40.0 | 80.0 | 54% |
| Expressive vocabulary (170) | 12.58 | 11.0 | -1.0 | 36.0 | 4% |
| Receptive vocabulary (170) | 11.53 | 12.0 | -7.0 | 29.0 | 13% |
| Expressive grammar (37) | 4.58 | 3.5 | -6.0 | 24.0 | 19% |
| Expressive information (40) | 8.01 | 8.0 | -5.5 | 23.0 | 14% |
A larger proportion of children made no progress (zero or less score gains) during the study on the measures of phoneme blending (42%), nonword reading (49%) and phonetic spelling (54%) than on the measures of single word reading (12%), letter-sound knowledge (14%), expressive vocabulary (4%), receptive vocabulary (13%), expressive grammar (19%) and expressive information (14%).
It is not possible to predict if an individual child will make little or no progress on any single or multiple measures if taught using the intervention, based on the data we collected. The only way to find out if the intervention will help an individual child is to try it for a sustained period of time.
Progress over 21 months
The discussion above presents our findings in respect of the effects of the intervention (as evaluated during the RCT phase) and the factors predicting rates of progress on word reading when receiving the intervention. During the study, we followed the children over three 20 week periods, assessing them at four time points over a combined period of 21 months. This is one of the largest data sets on educational progress for children with Down syndrome collected. Although we have no control comparison beyond the first phase of the study and are therefore limited in our ability to explore intervention effects in later phases, it is worth reporting this data to inform expectations about overall rates of progress for children with Down syndrome and to provide comparisons for future studies.
Figures 6-14 present the mean scores on our key measures at each of the time points. Further detail is provided in the supplementary Data Tables.
Throughout the study, average scores increased at each time point on all of these measures, indicating slow but continuing progress for many of the children. Over these 21 months, 45 out of 51 children (88%) made some progress on the word reading measure with half of all children gaining 9 or more words on this measure.
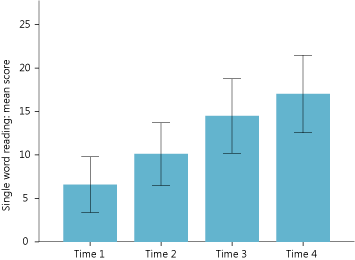 Figure 6 | Single word reading: growth over 21 months. (Mean scores of all children at four time points twenty weeks apart. Vertical bars indicate 95% Confidence Intervals. Maximum score possible: 79.) | 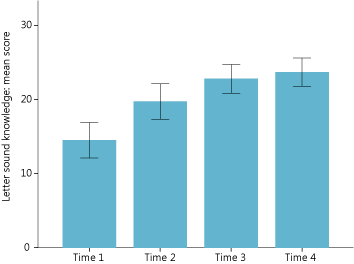 Figure 7 | Letter sound knowledge: growth over 21 months. (Mean scores of all children at four time points twenty weeks apart. Vertical bars indicate 95% Confidence Intervals. Maximum score possible: 32.) |
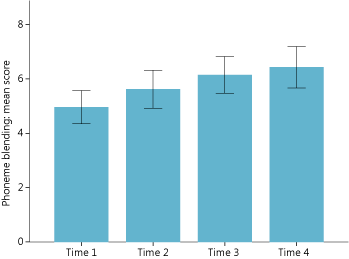 Figure 8 | Phoneme blending: growth over 21 months. (Mean scores of all children at four time points twenty weeks apart. Vertical bars indicate 95% Confidence Intervals. Maximum score possible: 10.) | 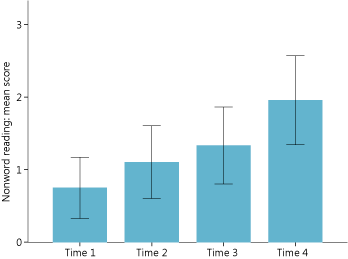 Figure 9 | Nonword reading: growth over 21 months. (Mean scores of all children at four time points twenty weeks apart. Vertical bars indicate 95% Confidence Intervals. Maximum score possible: 6.) |
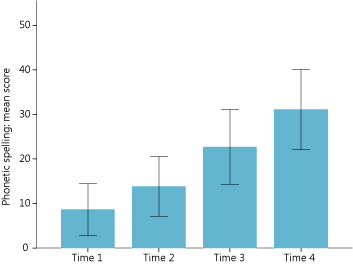 Figure 10 | Phonetic spelling: growth over 21 months. (Mean scores of all children at four time points twenty weeks apart. Vertical bars indicate 95% Confidence Intervals. Maximum score possible: 92.) | 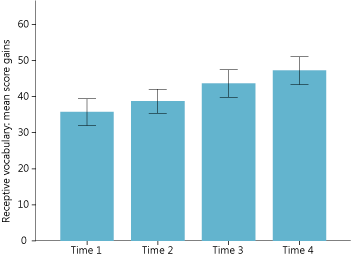 Figure 11 | Receptive vocabulary: growth over 21 months. (Mean scores of all children at four time points twenty weeks apart. Vertical bars indicate 95% Confidence Intervals. Maximum score possible: 170.) |
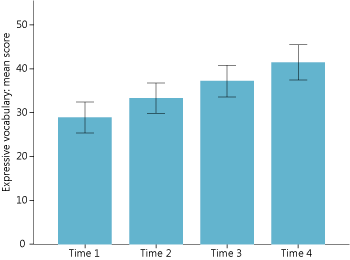 Figure 12 | Expressive vocabulary: growth over 21 months. (Mean scores of all children at four time points twenty weeks apart. Vertical bars indicate 95% Confidence Intervals. Maximum score possible: 170.) | 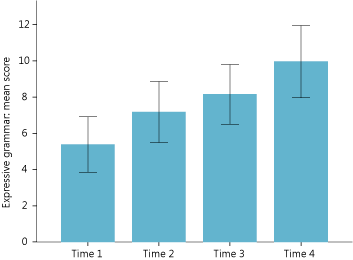 Figure 13 | Expressive grammar: growth over 21 months. (Mean scores of all children at four time points twenty weeks apart. Vertical bars indicate 95% Confidence Intervals. Maximum score possible: 37.) |
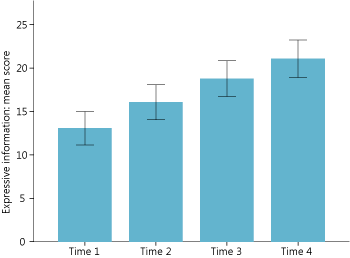 Figure 14 | Expressive information: growth over 21 months. (Mean scores of all children at four time points twenty weeks apart. Vertical bars indicate 95% Confidence Intervals. Maximum score possible: 40.) |
Conclusions
Our randomised controlled trial found that children receiving RLI for 20 weeks did better on a number of measures compared to children receiving teaching as usual. We can be most confident that that the gains observed on single word reading, letter sound knowledge, phoneme blending and taught expressive vocabulary are not due to chance.
Rates of progress for individual children varied widely with some children making substantial progress quickly, some children steadily making slower progress, and a few children making little or no progress. In general, children who started the programme at a younger age, who had better receptive language skills at the outset, and who received the most intervention sessions generally made the greatest progress.
The average gains observed for children receiving the intervention are important relative to the average rates of progress observed for children with Down syndrome receiving ordinary teaching. On most measures, most children with Down syndrome made progress over the 21 months during which we followed them.
< Evaluation | RLI Home Page | Feedback >


Further information
For further information, please select from the following:

