Changes in maternal age in England and Wales - implications for Down syndrome
The risk of having a pregnancy with Down syndrome increases with maternal age. The percentage of all births in England and Wales to mothers aged 35 and over increased from 9% in 1989 to 19% in 2003. A 51% increase in the numbers of pregnancies with Down syndrome has been observed over the same time period (from 954 to 1440). Due to improvements in antenatal screening for Down syndrome and the subsequent termination of affected pregnancies, the total number of births with Down syndrome decreased from 770 in 1989 to 609 in 2003. However the number of births with Down syndrome to women aged 35 and over increased from 186 in 1989 to 310 in 2003 because of the increasing number of pregnancies amongst these women.
Crane, E, and Morris, J. (2006) Changes in maternal age in England and Wales - implications for Down syndrome. Down Syndrome Research and Practice, 10(1), 41-43. doi:10.3104/reports.304
Introduction
The increase in maternal age in England and Wales has been well documented. Given it is known that the risk of Down syndrome increases with advancing maternal age, it is important to establish the effect of this rise in maternal age on the total number of babies born with Down syndrome, and in particular the numbers being born to women aged 35 and over, which may have implications for the long-term care of children with Down syndrome. The numbers of births with Down syndrome in England and Wales from 1989 to 2003 are examined using data from the National Down Syndrome Cytogenetic Register.
Methods
The National Down Syndrome Cytogenetic Register (NDSCR) holds data on prenatally and postnatally diagnosed cases of Down syndrome occurring in England and Wales from 1st January 1989 onwards. The methods of data collection and processing have been described previously (Mutton et al., 1991; Mutton et al., 1993). The information is derived from all clinical cytogenetic laboratories in England and Wales, who are requested to send a completed form for each diagnosis of trisomy 21 and its variants, including data on outcome of pregnancy, prenatal or postnatal diagnosis, age of mother at birth of baby and birth year (estimated for terminations), amongst other variables. The ascertainment of livebirths has been estimated to be over 94% complete (Mutton et al., 1991; Mutton et al., 1993).
The present report includes registrations up to December 31st 2003, and is based on 18664 pregnancies with Down syndrome, 9613 (51.5%) of them known to be livebirths. 595 of the prenatally diagnosed pregnancies have outcome unknown. In general only 5.8% of prenatally diagnosed cases results in a livebirth, so pregnancies with missing outcome are weighted as 0.058 livebirths to calculate the estimated number of livebirths. This gives an estimated total of 9646 livebirths.
Data on the total number of livebirths in England and Wales from 1989 to 2003 by single year of maternal age has been provided by the Office for National Statistics (ONS) (Tables 3.2, Birth Statistics Series FM1), and relates to a total of around 9.7 million livebirths.
Maternal age is available for 96% of the registered Down syndrome pregnancies and 92% of the livebirths. Missing maternal ages are assigned according to the observed probability distribution within each birth year and pre/postnatal diagnosis category.
Women with Down syndrome pregnancies have a different age distribution to the women with livebirths with Down syndrome because a large proportion of the pregnancies with Down syndrome are prenatally diagnosed and subsequently terminated. Separate analyses were performed for 3 groups: firstly mothers of all liveborn babies, secondly all mothers with a Down syndrome pregnancy and finally all mothers of livebirths with Down syndrome.
The data will be used to demonstrate changes between 1989 and 2003 in maternal age distribution, mean maternal age and the percentage of babies born to women aged 35 and over.
| Birth year | Number of Down syndrome live births | Percentage with maternal age ≥35 | |||
|---|---|---|---|---|---|
| Total (number missing maternal age) | Maternal age <35 a | Maternal age ≥35 a | Down syndrome live births | All live births in England and Wales b | |
| 1989 | 770 (29) | 584 | 186 | 24.2 | 8.6 |
| 1990 | 739 (10) | 536 | 203 | 27.5 | 8.7 |
| 1991 | 741 (17) | 529 | 212 | 28.6 | 9.1 |
| 1992 | 665 (23) | 469 | 196 | 29.5 | 9.7 |
| 1993 | 622 (27) | 457 | 165 | 26.5 | 10.3 |
| 1994 | 632 (43) | 433 | 199 | 31.5 | 11.1 |
| 1995 | 580 (30) | 374 | 206 | 35.5 | 11.9 |
| 1996 | 614 (31) | 405 | 209 | 34.0 | 12.6 |
| 1997 | 658 (40) | 409 | 249 | 37.8 | 13.7 |
| 1998 | 639 (48) | 389 | 250 | 39.1 | 14.5 |
| 1999 | 607 (49) | 351 | 256 | 42.2 | 15.4 |
| 2000 | 600 (36) | 352 | 248 | 41.3 | 16.6 |
| 2001 | 576 (100) | 311 | 265 | 46.0 | 17.3 |
| 2002 | 594 (104) | 333 | 261 | 43.9 | 18.1 |
| 2003 | 609 (150) | 299 | 310 | 50.9 | 18.7 |
| Total | 9646 (737) | 6231 | 3415 | 35.4 | 12.9 |
| a Births with missing ages apportioned according to the observed probability distribution within each birth year and diagnosis category b ONS data | |||||
Table 1 | Percentage of babies liveborn to mothers aged 35 and over- babies with Down syndrome and all babies
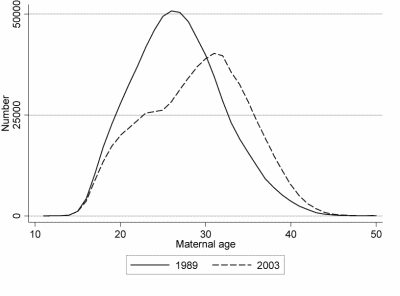
Figure 1 | Number of livebirths in 1989 and 2003 by maternal age (Source: ONS)
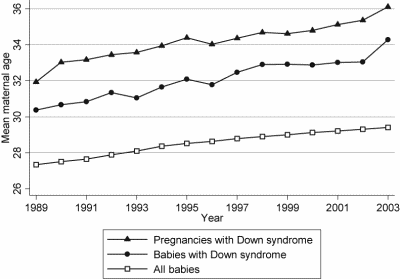
Figure 2 | Mean maternal age for all births, Down syndrome pregnancies and Down syndrome livebirths against year of birth (Source: ONS and NDSCR)
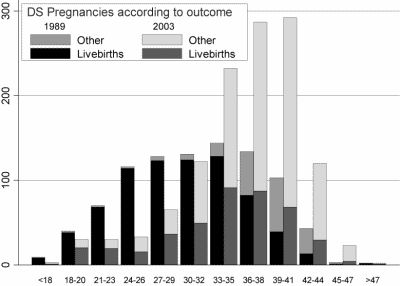
Figure 3 | Number of Down syndrome pregnancies and livebirths in 1989 and 2003 by 3-yearly categories of maternal age (Source: NDSCR)
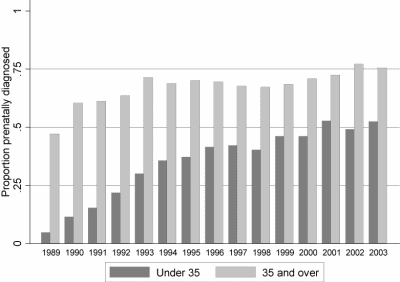
Figure 4 | Proportion of pregnancies with Down syndrome diagnosed prenatally annually from 1989 to 2003 by maternal age category (Source: NDSCR)
Results and Discussion
The distribution of all maternal ages in England and Wales in 1989 and in 2003 is shown in Figure 1. Maternal age has increased over time, with greater numbers of babies being born to older mothers. Nationally the mean maternal age increased from 27 to 29 years (Figure 2) and the percentage of all live babies born to mothers aged 35 and over increased from 9% in 1989 to 19% in 2003 (Table 1).
The total number of Down syndrome pregnancies increased from 954 in 1989 to 1440 in 2003. Women with Down syndrome pregnancies tend to be older than women with unaffected pregnancies, Figure 2 illustrates the greater mean age of women with Down syndrome pregnancies compared to all mothers (36 years compared to 29 in 2003). Figure 3 illustrates the distribution of maternal ages of women with Down syndrome pregnancies in England and Wales in 1989 and in 2003, with the proportion of mothers aged 35 and over increasing from 36% in 1989 to 64% in 2003.
Improvements in screening methods and uptake (Morris et al., 1994; NDSCR 2004 Annual Report) mean that the proportion of pregnancies with Down syndrome being diagnosed prenatally also increased from 1989 to 2003, although this has varied with maternal age. In 1989 only 5% of Down syndrome pregnancies amongst women aged under 35 were diagnosed prenatally, but this was true of 52% in 2003. The percentage was consistently higher amongst women aged 35 and over, being 47% in 1989 and increasing to 75% by 2003 (see Figure 4). About 6% of Down syndrome pregnancies diagnosed prenatally result in a livebirth, the majority (92%) being terminated and a small proportion (2%) resulting in a miscarriage or a stillbirth. Thus the number of babies liveborn with Down syndrome is highly dependent on the proportion diagnosed prenatally.
In total, in 1989 there were 770 livebirths with Down syndrome: 186 (24%) to women aged 35 and over, and 584 (76%) to younger women. By 2003 the total had fallen to 609 births: 310 (51%) to women aged 35 and over and 299 (49%) to younger women. For women aged 35 and over the increase in the number of all pregnancies and the corresponding increase in the number of Down syndrome pregnancies (Figure 3) were partly offset by the increase in the proportion diagnosed prenatally (Figure 4). The decrease in the number of all pregnancies to women under 35, a corresponding decrease in the number of Down syndrome pregnancies (Figure 3) and an increase in the proportion diagnosed prenatally resulted in the number of births with Down syndrome to mothers under 35 nearly halving between 1989 and 2003 (Table 1). The decreasing numbers of births to younger women and increasing numbers to older women also contributed to the average maternal age at livebirth of a baby with Down syndrome increasing from 30 to 34 years (Figure 2).
Conclusion
Between 1989 and 2003, the number of births with Down syndrome to mothers aged 35 and over increased from 186 to 310 while the number born to mothers aged under 35 decreased from 584 to 299. Thus despite the increase in maternal age in these years, the total number of births with Down syndrome decreased from 770 in 1989 (1 per 893 livebirths) to 609 in 2003 (1 per 1020 livebirths) due to increased screening and subsequent terminations.
These changes could have implications for the future care of persons with Down syndrome since the number of individuals with Down syndrome born to older mothers has increased.
Acknowledgements
Data collection for the NDSCR is funded by the National Screening Committee. We thank Haiyan Wu for maintaining the register and Eva Alberman for her helpful comments on this manuscript.
Correspondence
J.K.Morris • Centre for Environmental and Preventive Medicine, Wolfson Institute of Preventive Medicine, Barts and The London, Queen Mary's School of Medicine and Dentistry, Charterhouse Square, London EC1M 6BQ, UK • E-mail: j.k.morris@qmul.ac.uk
References
Morris, J.K., Mutton, D.E., Ide, R., et al. (1994). Monitoring trends in prenatal diagnosis of Down's syndrome in England and Wales, 1989-92. Journal of Medical Screening, 1, 233-7.
Morris, J.K., Mutton, D.E. & Alberman, E. (2002). Revised estimates of the maternal age specific live birth prevalence of Down's syndrome. Journal of Medical Screening, 9, 2-6.
Mutton, D.E., Ide, R., Alberman, E., et al. (1991). Results of first year (1989) of a national register of Down's syndrome in England and Wales. British Medical Journal, 303, 1295-7.
Mutton, D.E., Ide, R., Alberman, E., et al. (1993). Analysis of the number of Down's syndrome in England and Wales: trends in prenatal diagnosis 1989-91. British Medical Journal, 306, 431-2.
Birth Statistics Series FM1 nos.18-32. Office for National Statistics. Office of Population Censuses and Surveys, now ONS.
NDSCR 2003 Annual Report retrieved January 2006 from the World Wide Web: https://www.wolfson.qmul.ac.uk/ndscr/

