Relationships between hearing and auditory cognition in Down syndrome youth
Twenty-six adolescents and young adults with Down syndrome and 26 IQ- and CA-matched youth with other causes of intellectual impairment (comparison group) repeated a battery of audiological and auditory-cognitive tests on three annual assessments. Audiological tests revealed the following differences between the group with Down syndrome and the comparison group: a) Poorer acuity and longitudinal declines at each frequency from 250-8000 Hz for the group with Down syndrome, particularly at the highest frequencies; b) A tendency for the middle ear problems of Down syndrome individuals to be bilateral, chronic, and to reflect no mobility, retraction, or reduced mobility of the tympanic membrane; and c) Poorer reception and discrimination of speech in the group with Down syndrome. Correlational analyses revealed the following reliable relationships between performance on audiological and auditory-cognitive tests: a) individuals with Down syndrome who had lower speech discrimination scores, poorer acoustic reflexes, or bilaterally impaired tympanograms repeated spoken sentences less accurately; b) individuals with Down syndrome who had lower speech discrimination scores performed more poorly on a language comprehension task; and c) individuals with Down syndrome with impaired hearing (regardless of how it was measured) identified fewer spoken words when the words were rapidly followed by a masking noise or made discriminable by brief consonant sounds. It was suggested that poorer performance by hearing-impaired subjects with Down syndrome on auditory-cognitive tasks may have been due to an interaction of lower auditory acuity and slower processing speed. Also, because relationships between hearing and cognitive variables were not present in the comparison group, it was tentatively suggested that hearing loss may be more detrimental to cognitive abilities in intellectually impaired individuals with Down syndrome.
Marcell, M. (1995) Relationships between hearing and auditory cognition in Down syndrome youth. Down Syndrome Research and Practice, 3(3), 75-91. doi:10.3104/reports.54
Introduction
One well-established fact about the perceptual capabilities of the population with Down syndrome is its high rate of hearing problems (e.g., Cunningham and McArthur, 1981; Downs, 1983; Evenhuis, van Zanten, Brocaar and Roerdinkholder, 1992 ; van Gorp and Baker, 1984; Keiser, Montague, Wold, Maune and Pattison, 1981 ; Schwartz and Schwartz, 1978; Wilson, Folsom and Widen, 1983). An important empirical question that has not been widely addressed, however, is whether Down syndrome hearing problems are characteristic of individuals with Down syndrome or, instead, individuals who are moderately intellectually impaired. Only a few studies of Down syndrome hearing ability have included an intellectually impaired comparison group (Brooks, Wooley and Kanjilal, 1972; Buchanan, 1990), and only one study, to our knowledge, has included an intellectually impaired comparison group matched on both IQ and CA (Dahle and McCollister, 1986). Dahle and McCollister (1986) found that children with Down syndrome have a significantly higher prevalence of hearing and otologic disorders than their matched peers. A central question addressed in the present study is whether adolescents and adults with Down syndrome have poorer hearing abilities than same-age, equally-intelligent intellectually disabled peers.
A second question that has not been systematically addressed in audiological research with individuals with Down syndrome is whether relationships exist between their hearing abilities and their performance on acoustically-based cognitive tasks such as digit recall, language comprehension, and word identification. Research with the general population has established links between hearing and language abilities (Paul and Quigley, 1987); for instance, children with recurrent middle ear infections are prone to deficient phonological skills, delayed language acquisition, expressive language disorder, and lowered academic achievement (e.g., Lonigan, Fischel, Whitehurst, Arnold and Valdez-Menchaca, 1992 ; Needleman, 1977; Paden, Novak and Beiter, 1987; Silva, Kirkland, Simpson, Stewart and Williams, 1986 ; Teele, Klein and Rosner, 1984; Zinkus, Gottlieb and Schapiro, 1978). Although a few studies of individuals with Down syndrome have reported a relationship between hearing impairment and some aspect of cognitive functioning (Davies and Penniceard, 1980; Keiser et al., 1981; Libb, Dahle, Smith, McCollister and McClain, 1985 ; Whiteman, Simpson and Compton, 1986), none have systematically screened multiple cognitive measures and only one (Nolan, McCartney, McArthur and Rowson, 1980) has included an intellectually impaired comparison group. Nolan et al. (1980) found that adults with Down syndrome who had higher pure tone hearing losses tended to have lower receptive vocabularies; however, their failure to control for receptive vocabulary variation due to chronological age limits the potential usefulness of the finding. A second issue addressed in the present study, then, is whether relationships between hearing and auditory-cognitive abilities exist in the Down syndrome population and, if so, are the relationships different from those of other youth with intellectual disabilities who do not have Down syndrome.
This paper summarizes findings from a longitudinal study of a group of adolescents and young adults with Down syndrome and an IQ- and CA-matched group of intellectually impaired individuals without Down syndrome. Hearing abilities were measured by standard audiological tests, and auditory-cognitive abilities by language and memory tasks that required the initial processing of acoustic-verbal information, the forming of mental representations, and the performing of actions (e.g., speaking, pointing) based on the representations. Audiological assessment outcomes are described in Part I of this paper and analyses of relationships between audiological and auditory-cognitive tasks are reported in Part II. The results obtained on the auditory-cognitive tasks themselves, although briefly summarized, are reported elsewhere (e.g., Marcell, Ridgeway, Sewell and Whelan, 1995).
Methodology
Participants
Twenty-six adolescents and young adults with Down syndrome and 26 non-Down syndrome intellectually impaired (the comparison group) were matched in the first year of the study on chronological age (Down syndrome mean = 18 years, 10.1 months; comparison group mean = 18 years, 8.5 months) and Stanford-Binet IQ scores obtained from school files (Down syndrome mean = 39.7; comparison group mean = 40.9). Group matching was accomplished by the frequency distribution control technique (Christensen, 1988). Participants were recruited from 11 local schools (N = 44), a residential institution (N = 2), and two community programs for intellectually impaired adult citizens (N = 6 recent school graduates) in the Charleston, South Carolina (USA), area. All subjects had been educationally classified as "trainable" (moderately) intellectually impaired by their school systems. The members of the comparison group represented various etiologies that were described by Marcell and Cohen (1992). Retention of subjects across the three assessments (1989, 1990, 1991) was excellent; only one subject from the comparison group who moved after the first year and one subject from the group with Down syndrome who moved after the second year were replaced.
Brief Overview of Project Design
Participants spent one day at the College of Charleston for each of three consecutive summers participating in an individualized programme of standardized language testing, computer-based memory experiments, and an audiological assessment, with the language and memory tasks presented in a random order and the audiological assessment given at the end of the day. Successful completion of each task earned the subject a sticker and, at the end of the day, a reward such as a College T-shirt or a cash payment. The typical day began at 9.00 am, ended at 3.00 pm, and involved one or two participants seen by two-to-four experimenters. Play activity breaks (outdoor picnic, crafts, computer games, rest periods, and refreshments) were scheduled intermittently. Most participants enjoyed their summer visits to the College and did not want the study to end.
Part I: Audiological Assessment
Description of Audiological Protocol
The audiological protocol included three components - pure tone audiometry, immittance measurement, and speech audiometry - that were readministered annually. A typical audiological assessment lasted about 25-45 minutes and was administered at the nearby Charleston Speech and Hearing Center by clinical audiologists who were experienced in working with intellectually impaired individuals. Stimuli were presented in a double-walled Industrial Acoustics Controlled Acoustical Environment. Audiometric and immittance measurements were made with a Maico Model MA32 Audiometer and a Madsen Model Z073 Electroacoustic Impedance Bridge (see Marcell and Cohen, 1992, for additional details). Our intention was to measure hearing sensitivity "as is" on the day of auditory-cognitive testing. Thus, excessive wax, which was noted in 17.5% of the Down syndrome ears and 11.7% of the comparison group ears across Years 1- 3, was not removed (cf. Dahle and McCollister, 1986), and bilateral composite data, rather than data from only the better ear, were used to create audiological dependent variables (Coren, 1989). Masking of the non-test ear was used, as needed, to prevent cross-hearing during pure tone and speech audiometry assessments. On 43% of the Down syndrome assessments and 14% of the comparison group assessments audiologists recommended to parents that additional ENT or medical exams be obtained (we did not determine whether the follow-up exams were actually obtained). Only one individual (a participant with Down syndrome) wore a hearing aid during the project.
Pure Tone Audiometry
Air conduction measurements provided an index of sensitivity to pure tones in the frequency range of 250-8000 Hz. A bilateral composite measure was created by averaging decibel hearing level (dbHL) thresholds across both ears at each frequency [the average correlations between left and right ears for all subjects in Years 1-3 were .71,.87, and .91, respectively]. Bilateral composite air conduction scores were stable from Years 1 to 2 and Years 2 to 3 for both the group with Down syndrome (.81 and.83, respectively) and the comparison group (.82 and .85). Play audiometry or forced response audiometry was used in 8% of the Down syndrome and 8% of the comparison group assessments.
Pure tone bone conduction measurements provided a rough indicator of sensorineural sensitivity in the 250-4000 Hz range. A bilateral composite measure was created by averaging decibel hearing level (dbHL) thresholds across both ears at each frequency [the average bone conduction correlations between left and right ears for all subjects in Years 1-3 were .76, .81, and .87, respectively]. Bilateral composite bone conduction scores were stable from Years 1 to 2 and Years 2 to 3 for both the group with Down syndrome (.66 and .61, respectively) and the comparison group (.91 and .94).
The relationship between air and bone conduction measurements produced, for each ear, an audiological classification of type of hearing loss as conductive, sensorineural, mixed, or none (see Marcell and Cohen, 1992, for criteria used to categorize type of hearing loss). Audiological categories were also collapsed into two types, normal and impaired, for year-by-year chi square analyses. The air-bone gap (air conduction minus bone conduction scores, averaged bilaterally across 250-4000 Hz) provided a rough indicator of the overall conductive component of hearing loss.
Immittance Measurement
Impedance techniques provided an objective assessment of the integrity of middle ear functioning. Compliance tympanograms for a 220 Hz probe tone were manually plotted for each ear at different air pressure loads ranging from +200 to -200 mm H2O or below. Each tympanogram was categorized as representing a middle ear that was either functioning normally or showing reduced mobility, no mobility, retraction, or hyper-flaccidity. The tympanogram categories were also collapsed into two types, normal and impaired, for year-by-year chi square analyses.
Acoustic (stapedial) reflex thresholds elicited in each ear by contralateral acoustic stimulation at 500, 1000, 2000, and 4000 Hz provided a rough approximation of the intactness of middle ear functioning. A bilateral acoustic reflex score represented the number of times out of eight that the reflex was elicited in the two ears across the four frequencies; a reflex was considered absent if it could not be elicited within the 85-115 db range. Correlational analyses confirmed that acoustic reflex scores were stable from Years 1 to 2 and Years 2 to 3 for the group with Down syndrome (.95 and .93, respectively), but variable for the comparison group (.14 and .82). Comparison group variability was due to the extreme scores of one subject; when this individual's data were omitted, correlational analyses indicated general stability of comparison group acoustic reflex measurement from Years 1 to 2 (.60) and Years 2 to 3 (.71).
Speech Audiometry
Speech reception threshold (SRT) scores, averaged across both ears, provided an index of the lowest intensity level at which common, two-syllable spondaic words (such as "cowboy" and "hot dog", presented by monitored live voice) were just intelligible. The average SRT correlations between left and right ears for all subjects in Years 1-3 were .66, .85, and .79, respectively. SRT measurements were stable from Years 1 to 2 and Years 2 to 3 for both the group with Down syndrome (.85 and .95, respectively) and the comparison group (.75 and .81). The reliability of SRT measurements was also checked through comparison with pure tone air conduction thresholds averaged across 500, 1000, and 2000 Hz (PTA). Agreement was excellent, with an average SRT-PTA difference of only 1.9 db for each group and an average SRT-PTA correlation of .93 for the group with Down syndrome and .92 for the comparison group.
After SRT was established, the audiometer was reset at 40 dbSL (i.e., 40 db above SRT) and a list of monosyllabic words was spoken in a quiet background for a measure of speech discrimination. The bilateral speech discrimination score reflected the percentage of words correctly recognized out of 50 (25 per ear). The average speech discrimination correlations between left and right ears for all subjects in Years 1-3 were .67, .87, and .71, respectively. Speech discrimination measurements were relatively stable from Years 1 to 2 and Years 2 to 3 for both the group with Down syndrome (.77 and .59, respectively) and comparison group (.51 and .63). Picture-pointing (rather than oral) responses were employed in speech audiometry assessments for 10% of the group with Down syndrome and 5% of the comparison group.
Audiological Data Considerations
In order to avoid loss of subjects during longitudinal analyses of variance, missing values (such as a Year 2 4000 Hz pure tone air conduction measurement) were estimated on the basis of available adjacent values (e.g., the average of the Year 2 measurements at 2000 and 8000 Hz) (Tabachnick and Fidell, 1989). If the missing data point were a summary score (e.g., a subject's speech discrimination score for Year 3), then scores from the two available years (e.g., speech discrimination scores from Years 1 and 2) were used to estimate the missing value; missing values were not estimated when data for a measure were available for only one year. Estimated values were used only in ANOVAs with pure tone and speech audiometry measures and not in correlational or categorical analyses. The total percentage of estimated audiological data points was small (1.7%) and did not significantly alter ANOVA results. Newman-Keuls post hoc analyses (alpha = .05) were used to explore significant effects from analyses of variance.
Results
The group with Down syndrome performed more poorly than the comparison group on each component of the audiological assessment.
Pure Tone Audiometry
Air Conduction
A 2 (group) x 3 (year) x 6 (frequency) ANOVA on bilateral composite air conduction scores revealed significant main effects of group [F (1,50) = 9.51, p = .003] and frequency [F (5, 250) = 19.45, p < .0001] that were qualified by a significant group x frequency interaction effect [F (5, 250) = 4.64, p < .0001]. The overall air conduction hearing threshold was higher (i.e., hearing sensitivity was poorer) for the group with Down syndrome (mean = 22.2 dbHL, a mild hearing loss) than the comparison group (mean = 12.7 dbHL, normal hearing). Also, as can be seen in Figure 1, the group with Down syndrome had significantly poorer hearing than the comparison group at each frequency, with an especially large difference at 8000 Hz. Within each group, hearing thresholds from 250 - 2000 Hz did not differ from each other. In the group with Down syndrome, hearing thresholds at 4000 and 8000 Hz were poorer than all lower frequencies; however, in the comparison group, thresholds at 4000 and 8000 Hz were poorer than frequencies 1000 Hz or below. The ANOVA also revealed a main effect of year [F (2, 100) = 4.45, p = .014] that was qualified by a year x frequency interaction effect [F (10, 500) = 1.89, p = .045]. A decline in hearing was observed in Year 3, with losses occurring at the two highest and two lowest frequencies. Finally, the analysis revealed a marginally significant group x year x frequency interaction effect, F (10, 500) = 1.69, p = .081 (see Figure 2). The group with Down syndrome developed significantly poorer hearing at each frequency by the final year of the project, with hearing sensitivity at 8000 Hz approaching 40dbHL; in contrast, the comparison group showed no changes in hearing ability at any frequency from the beginning to the end of the project.
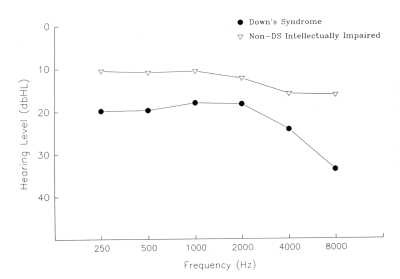
Figure 1. Pure tone air conduction thresholds for each group, Years 1-3 combined.
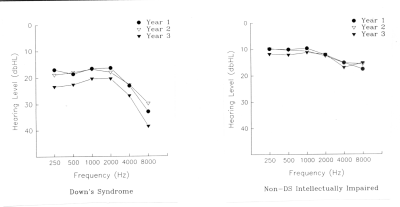
Figure 2. Pure tone air conduction thresholds for each group, year-by-year.
Wilson et al. (1983) classified subjects with Down syndrome by hearing thresholds of 10 dbHL or greater and found that 87% had losses at 8000 Hz. Using the same criterion for the final year of this project, we found that 88% of subjects with Down syndrome (but only 54% of subjects in the comparison group) showed a high frequency hearing loss. Reclassification with a 15 dbHL-or-greater hearing loss criterion supported the pattern of greater Down syndrome (79%) than comparison group (35%) loss at 8000 Hz.
Bone Conduction
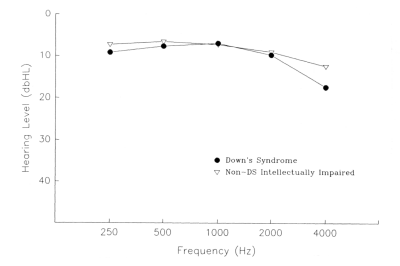
Figure 3: Pure tone bone conduction thresholds for each group, Years 1-3 combined.
A 2 (group) x 3 (year) x 5 (frequency) ANOVA on the bilateral composite bone conduction scores revealed significant main effects of year [F (2, 94) = 8.76, p <.0001] and frequency [F (4, 188) = 23.80, p < .0001] that were qualified by interaction effects involving year x frequency [F (8, 376) = 2.73, p = .006], group x frequency [F (4, 188) = 2.30, p = .060], and group x year x frequency [Wilks' Lambda F (8, 40) = 2.80, p = .015]. The results may be summarized as follows: a) The overall bone conduction hearing thresholds for the Down syndrome and comparison group subjects did not differ (mean = 10.2 vs 8.4 dbHL, respectively); b) Bone conduction thresholds were equivalent for the two groups at every frequency except the highest (4000 Hz), where the group with Down syndrome showed significantly poorer hearing than the comparison group (see Figure 3); and c) Both groups showed decline over time in bone conduction hearing ability at 4000 Hz, with the group with Down syndrome also showing decline at 2000 Hz.
Audiological Classification and Air-Bone Gap
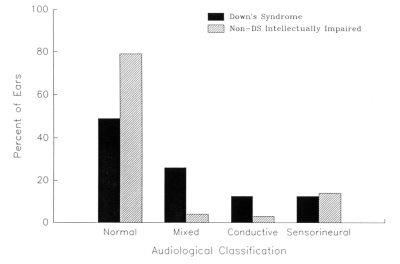
Figure 4: Per cent of ears in audiological (air bone) categories for each group, Years 1-3 combined.
Figure 4 summarizes the percentage of ears assigned to each of the four original audiological categories during the three-year period. There appeared to be fewer normal ears in children with Down syndrome than in the comparison group and more ears of children with Down syndrome showing hearing losses of the mixed or conductive types; the percentages of the group with Down syndrome and comparison group ears showing a sensorineural hearing loss did not appear to differ. Table 1 contains tabulations and outcomes for separate 2 (group) x 2 (normal vs impaired audiological classification) chi square analyses of left and right ears for each year of the project. Four of the six analyses confirmed an association between group membership and audiological classification: the group with Down syndrome had more impaired ears and fewer normal ears than the comparison group.
| Group | ||||||
|---|---|---|---|---|---|---|
| Down Syndrome | Non-Down syndrome Intellectually impaired (comparison group) | |||||
| Audiological Classification | ||||||
| Time of Assessment | Ear | Normal | Impaired | Normal | Impaired | Results of Chi Square Analysis |
| Year 1 | Left | 11 | 15 | 20 | 5 | c2 (1, N=51) = 7.60, p < .006 |
| Right | 16 | 10 | 19 | 6 | c2 (1, N=51) = 1.24, p < .265 | |
| Year 2 | Left | 13 | 13 | 20 | 6 | c2 (1, N=52) = 4.06, p < .042 |
| Right | 15 | 11 | 20 | 6 | c2 (1, N=52) = 2.19, p < .136 | |
| Year 3 | Left | 10 | 14 | 21 | 5 | c2 (1, N=50) = 8.10, p < .005 |
| Right | 10 | 14 | 21 | 5 | c2 (1, N=50) = 8.10, p < .005 | |
A 2 (group) x 3 (year) ANOVA of the air-bone gap data revealed a significant main effect of group, F (1, 47) = 11.58, p = .001. The overall air-bone gap was larger in the group with Down syndrome (mean = 9.7 dbHL) than the comparison group (mean = 3.4 dbHL) suggesting a greater conductive contribution to hearing loss in the group with Down syndrome.
Immittance Measurement
Tympanometry
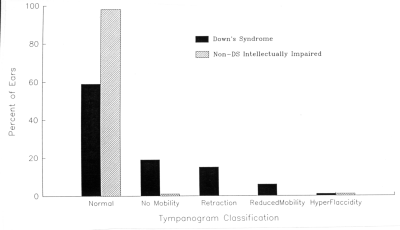
Figure 5. Per cent of ears in tympanogram categories for each group, Years 1-3 combined.
Figure 5 summarizes the percentage of ears assigned to each of the five original tympanogram categories across the three-year period. There appeared to be fewer Down syndrome than comparison group ears with normal tympanograms and more Down syndrome ears showing middle ear problems indicative of no mobility, retraction, or reduced mobility of the tympanic membrane; the percentages of the Down syndrome and comparison group ears showing hyper-flaccidity did not differ. Table 2 contains tabulations and outcomes for separate 2 (group) x 2 (normal vs impaired tympanogram classification) chi square analyses of left and right ears for each year of the project. All six analyses confirmed an association between group membership and type of tympanogram: subjects with Down syndrome had more impaired ears and fewer normal ears than the comparison group subjects.
| Time of Assessment | Group | |||||
|---|---|---|---|---|---|---|
| Down Syndrome | Non-Down syndrome Intellectually impaired (comparison group) | |||||
| Tympanogram Classification | ||||||
| Ear | Normal | Impaired | Normal | Impaired | Results of Chi Square Analysis a | |
| Year 1 | Left | 13 | 13 | 25 | 0 | c2 (1, N=51) = 16.78, p < .0002 |
| Right | 13 | 13 | 25 | 0 | c2 (1, N=51) = 16.78, p < .0002 | |
| Year 2 | Left | 16 | 10 | 24 | 1 | c2 (1, N=51) = 8.95, p < .003 |
| Right | 16 | 8 | 24 | 1 | c2 (1, N=49) = 5.21, p < .022 | |
| Year 3 | Left | 15 | 8 | 26 | 0 | c2 (1, N=49) = 8.41, p < .004 |
| Right | 15 | 8 | 24 | 1 | c2 (1, N=48) = 5.57, p < .018 | |
| a For three of the tabulations (Year 2--right ear, Year 3--left ear, and Year 3--right ear), one or more of the expected cell frequencies was less than 5. Chi square values calculated for those analyses incorporated Yates' correction for continuity (Siegel and Castellan, 1988). | ||||||
There was a strong tendency for Down syndrome middle ear problems to be bilateral: 90% of individuals with Down syndrome identified as having one or more abnormal tympanograms during the project actually had bilateral abnormal tympanograms. Furthermore, Down syndrome middle ear problems tended to be chronic: of the 13 individuals with Down syndrome who showed bilateral abnormal tympanograms at least once during the project, 11 (85%) showed bilateral abnormal tympanograms on at least one other assessment. Although the 11 subjects with Down syndrome with repeated bilateral abnormal tympanograms tended to be slightly younger and less intelligent (mean CA = 221 months; mean IQ = 38) than the other subjects with Down syndrome (mean CA = 230 months, mean IQ = 41), these differences were not significant [t (24) = .58 for CA and t (24) = 1.07 for IQ].
Acoustic Reflexes
Of all tasks administered during the project, the acoustic reflex measure yielded the lowest rates of completion, largely be cause of subject restlessness, lack of subject cooperation, and/or inability of the audiologist to maintain a seal (cf. Tucker and Nolan, 1986). Because of the large number of missing data points (bilateral acoustic reflex measurement rates averaged only 76% in the group with Down syndrome and 82% in the comparison group), separate analyses were conducted for each year. As can be seen in Figure 6, fewer acoustic reflex responses were elicited in the group with Down syndrome than the comparison group in Year 1 [t (46) =4.09, p < .0001], Year 2 [t (35) = 3.84, p = .001], and Year 3 [t (35) = 2.27, p = .03]; furthermore, the number of reflexes elicited in each group did not appear to change over time.
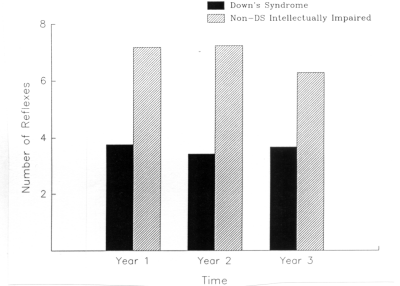
Figure 6. Number of acoustic reflexes for each group, year-by-year.
Speech Audiometry
Speech Reception Threshold
Group bilateral SRT scores for each year of the project can be found in Figure 7. A 2 (group) x 3 (year) ANOVA revealed significant main effects of group [F (1, 50) = 8.62, p = .005] and year [F (2, 100) = 12.06, p < .0001]. The group with Down syndrome had a significantly higher SRT score (i.e., poorer reception of speech) than the comparison group (mean = 17.0 vs 9.4 db), and both groups showed increases in SRT from the beginning to the end of the project.
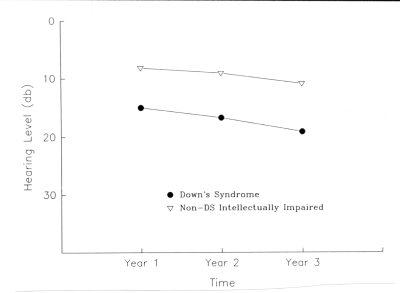
Figure 7. Speech reception thresholds for each group, year-by-year.
Speech Discrimination
Group bilateral speech discrimination scores for each year of the project can be found in Figure 8. A 2 (group) x 3 (year) ANOVA revealed main effects of group [F (1, 50) = 5.68, p = .021] and year [F (2, 100) = 4.34, p = .016], that were qualified by an interaction effect of group x year [F (2, 100) = 2.75, p = .069; Wilks' Lambda F (2, 49) = 4.03, p = .024]. Although speech discrimination performance was high (above 90%) for both groups, the group with Down syndrome had significantly lower scores than the comparison group during Years 1 and 2; also, the group with Down syndrome showed improved performance during Year 3. Informal investigation of the Year 3 improvement in speech discrimination suggested that improvement was shown both by Down syndrome subjects with impaired hearing and Down syndrome subjects with normal hearing. The reason for this improvement is unknown, and the reliability of the change cannot be confirmed without a Year 4 data point.
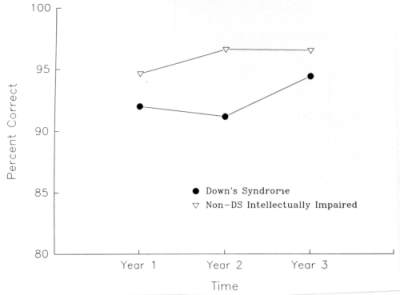
Figure 8. Speech discrimination scores for each group, year-by-year.
Supplementary analyses addressed whether the overall lower speech discrimination scores of subjects with Down syndrome were produced primarily by Down syndrome individuals with significant hearing impairment (as indexed by pure tone thresholds and tympanogram measures). In the first analysis, each Down syndrome ear was separately categorized on the basis of audiological (air-bone) classification as being either normal or impaired, and the associated speech discrimination score for that ear was tabulated (see Figure 9). One-tailed t tests revealed that in Years 1 [t (50) = 3.26, p = .005], 2 [t (48) = 4.69, p < .0005], and 3 [t (46) = 4.42, p < .0005], the mean speech discrimination score obtained by the subgroup of Down syndrome impaired ears was lower than that obtained by the subgroup of Down syndrome normal ears. In the second analysis, tympanogram classifications were used in the same manner to create subgroups of normal and impaired Down syndrome ears (see Figure 10). The results were essentially unchanged: One-tailed t tests revealed that in Years 1 [t (50) = 4.00, p < .0005] and 3 [t (44) = 2.39, p < .025], the mean speech discrimination score obtained with impaired ears was significantly lower than that obtained with normal ears. It is likely, then, that the lower overall speech discrimination performance of the group with Down syndrome was due primarily to the poorer performance of those individuals with impaired hearing.
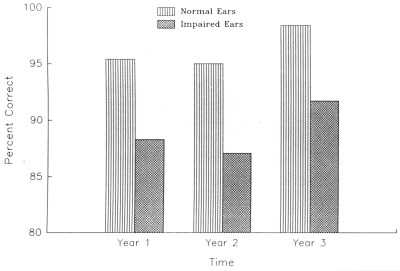
Figure 9. Speech discrimination scores of Down syndrome normal or impaired ears (audiological classification), year-by-year.
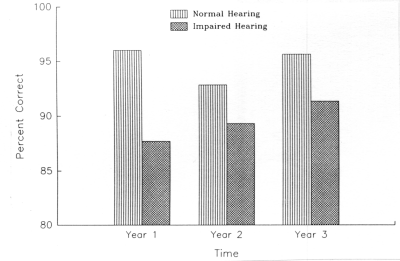
Figure 10. Speech discrimination scores of Down syndrome normal or impaired ears (tympanogram classification), year-by-year.
Part II: Relationships between Audiological and Auditory-Cognitive Assessments
Description of Auditory-Cognitive Protocol
Although several auditory-cognitive tasks were administered over the course of the project, only tasks used on at least two of the three assessments are evaluated here. Repeated auditory-cognitive tasks included sentence imitation, language comprehension, backward masking of spoken words, word identification, auditory-verbal short-term memory, receptive vocabulary, and oral vocabulary. Tasks were administered in two sound-attenuated rooms equipped with testing materials, tape recorders, microphones, and computer. The typical task lasted about 10-15 minutes; the longest (language comprehension) was divided into two separate testing sessions to minimise fatigue.
Screening Procedure
The following steps were used to determine whether relationships existed between performance on audiological tasks and auditory-cognitive tasks. First, one quantitative measure was selected to represent each component of the audiological assessment for correlational analyses. The measures selected were the bilateral air conduction score (pure tone audiometry), the bilateral acoustic reflex score (immittance measurement), and the bilateral speech discrimination score (speech audiometry). Second, one quantitative measure was selected to represent each of the auditory-cognitive tasks (these measures are described in subsequent sections). Third, Pearson bivariate correlations between the audiological and auditory-cognitive measures were performed for each assessment time. To reduce the number of spurious correlations, a relationship between a hearing measure and an auditory-cognitive measure was considered reliable only if it was obtained on at least two of the three assessments. Fourth, each replicated significant relationship was reanalysed with a partial correlation procedure to determine whether the relationship held when the effects of chronological age were removed; it is these partial correlations that are reported in tables. Fifth, persistent relationships identified through partial correlational procedures were re-examined from a categorical perspective. Because all such relationships involved only the group with Down syndrome, the categorical measure which most clearly separated the Down syndrome and comparison group subjects - tympanogram classification - was used to assign individuals with Down syndrome to one of two subgroups: a) those with bilateral impaired hearing, or b) those with normal hearing in one or both ears. One-tailed t-tests were then used to contrast the performance of these two subgroups with Down syndrome on the targeted auditory-cognitive task. For each such task it was hypothesized that the subgroup of Down syndrome individuals with bilateral impaired tympanograms would perform poorer.
Sentence Imitation
A different sentence imitation task was used during each year of the project. In the Year 1 sentence imitation task, the subject attempted to repeat standardized sentences of varying grammatical constructions and lengths that were spoken by the examiner. In Year 2, the subject attempted to repeat audiotaped sentences in which the grammatical structure (declarative) was held constant and the sentence length was increased gradually from 2 to 10 one-syllable words. In Year 3, the subject attempted to repeat 2- to 6-word long sentences from the Year 2 sentence set. Each year's dependent variable was created by awarding one point for every correctly-recalled word in the sentence set, ignoring misarticulations. Results obtained with sentence imitation tasks were consistent across all three testings: subjects with Down syndrome imitated sentences less accurately than comparison group subjects, and their poorer accuracy was apparent in sentences with three or more words (Marcell et al., 1995).
Language Comprehension
The Miller-Yoder Language Comprehension Test (Miller and Yoder, 1984), a standardized task designed for use with intellectually impaired individuals, was employed to assess the understanding of spoken sentences of varying grammatical constructions. The examiner spoke a 4- or 5-word sentence (e.g., "Mother is kissed by father") while the subject attempted to point to the picture that correctly represented the sentence (there were four pictures on the response page). The subject was awarded one point for each pair of sentences correctly identified out of the 42 sentence pairs presented. Results with this task suggested that individuals in both the Down syndrome and the comparison groups functioned at the language comprehension level of 3-to-4-year-old typically developing children ( Marcell, Croen, Mansker, and Sizemore, 1994 ).
Backward Masking
In Year 1 a computer-based backward masking task was used in which a 500-msec digitized concrete noun (e.g., "plate") was spoken from a computer and rapidly followed (40, 80, 160, or 320 msec later) by a 500-msec burst of white noise. The subject's task was to repeat the spoken word; the purpose of the masking noise was to interfere with the subject's identification of the word. It was assumed that if the subject had completed processing the word before the noise mask, then the word could be repeated. By varying the onset time of the noise mask we hoped to index the speed of auditory word processing. Participants with Down syndrome identified fewer words in the fastest (40 msec) masking condition and did not differ significantly from comparison group participants in the other conditions (Marcell, Croen, and Sewell, 1991). The dependent variable used in correlational analyses was the number of words repeated (out of seven) in the fastest (40 msec) and slowest (320 msec) masking conditions.
Although the backward masking task was not administered in Year 2, it was given in a different form in Year 3. In Year 3 the digitized word spoken from the computer (e.g., "cake") was followed either 20 or 120 msec later by white noise, and the subject identified the word not by repeating it, but instead by pointing on the computer screen to one of two pictures whose names differed only in the ending sound (e.g., cake or cage). The silent pointing procedure removed the oral expression component of the previous backward masking task. Because the groups did not differ on the two masking conditions, the dependent variable was the number of words correctly recognized out of 18 across the combined masking conditions.
Word Identification
The purpose of this task, first presented in Year 2, was to determine whether individuals with Down syndrome experience greater difficulty than comparison group peers in identifying one-syllable nouns made discriminable by stop consonants (sounds which differ by short-duration acoustic cues) rather than vowels (sounds which differ by longer-duration acoustic cues) (cf. Reed, 1989; Tallal, 1980). The subject looked at a page with two drawings while listening over headphones to an audio recording of a person speaking one of two names; the task was to point to the drawing that corresponded to the spoken word. The names of the drawings differed in either the initial stop consonant sound (e.g., "boat" - "goat") or the vowel sound (e.g., "deer" - "door"). The dependent variable was the number of errors in the consonant and vowel conditions (8 possible errors per condition). In the Year 3 word identification task, synthesized (computer-generated) words were used instead of human speech and twice as many words (16) were presented in each condition. Results with both the Year 2 and Year 3 tasks revealed that the group with Down syndrome made more identification errors than the comparison group on words differing in consonant, but not vowel, sounds ( Marcell, Sizemore, Mansker, Busby, Powell, Ridgeway, West, and Whelan, 1992 ).
Other Auditory-Cognitive Tasks
Other auditory-cognitive tasks administered during the study included auditory-verbal short-term memory (number of spoken digits repeated in sequence), receptive vocabulary (number of spoken words correctly identified by pointing to one of four drawings), and oral vocabulary (number of spoken words correctly defined or described). Because the screening procedures identified no significant, reliable relationships between these tasks and audiological variables, the tasks were not considered further.
Results - Part II
Significant correlations between auditory-cognitive and audiological task performances were present only for subjects with Down syndrome and indicated that greater hearing impairments were accompanied by poorer performance on auditory-cognitive tasks.
Sentence Imitation
The data presented in Table 3 indicate that in each of three years there was a positive association between speech discrimination and sentence imitation: Down syndrome subjects with poorer speech discrimination scores tended to repeat fewer words from sentences. In contrast, there was no relationship between speech discrimination and sentence imitation in the comparison group. Also, in two of the three years, Down syndrome subjects with poorer acoustic reflexes tended to imitate sentences less accurately; in contrast, comparison group subjects showed no acoustic reflex-sentence imitation relationship. When subjects with Down syndrome were subdivided into two groups on the basis of tympanogram classification (see Table 4), t-tests revealed that in two of three years, the subgroup of bilaterally hearing-impaired individuals repeated sentences less accurately than the subgroup of individuals with normal hearing in one or both ears. Thus, Down syndrome youth with poorer speech discrimination ability, lower acoustic reflex scores, or bilaterally impaired tympanograms (but not lower pure tone audiometry scores) tended to repeat spoken sentences less accurately. 1
| Group | ||||||
|---|---|---|---|---|---|---|
| Down Syndrome | Non-Down syndrome Intellectually impaired (comparison group) | |||||
| Time of Assessment | ||||||
| Hearing Measure | Year 1 | Year 2 | Year 3 | Year 1 | Year 2 | Year 3 |
| Air Conduction (Pure Tone Audiometry) | -.136 | -.232 | -.274 | .194 | .102 | .115 |
| Speech Discrimination (Speech Audiometry) | .562** | .453* | .411* | .053 | .026 | -.018 |
| Acoustic Reflexes (Immittance Measurement) | .435* | .310 | .786** | -.041 | -.151 | -.038 |
| Note: Values are partial correlations with the effects of chronological age removed. * p < .05 ** p < .01 | ||||||
| Tympanogram Type | |||||
|---|---|---|---|---|---|
| Normal or Unilateral Impaired | Bilateral Impaired | ||||
| Time of Assessment | N | Mean Number of Words Repeated (SD) | N | Mean Number of Words Repeated (SD) | Result |
| Year 1 | 13 | 30.9 (10.6) | 12 | 21.8 (12.1) | t (23) = 2.01* |
| Year 2 | 16 | 57.6 (18.4) | 8 | 51.9 (15.4) | t (22) = 0.75 |
| Year 3 | 15 | 29.0 (3.3) | 8 | 24.3 (4.7) | t (21) = 2.85** |
| Note. The total number of words available for recall were 54 (Year 1), 108 (Year 2), and 40 (Year 3). The standard deviation is in parentheses next to the mean. * p < .05 ** p < .005 | |||||
Language Comprehension
The data presented in Table 5 indicate that speech discrimination was reliably associated with language comprehension in the group with Down syndrome: In each year, Down syndrome subjects with lower speech discrimination scores tended to comprehend fewer sentences; in contrast, a speech discrimination-language comprehension relationship was not present in the comparison group. The categorization of subjects with Down syndrome into two subgroups (those with or without bilateral impaired tympanograms) revealed no significant differences in language comprehension performance across the three years. Thus, although speech audiometry indicated that Down syndrome individuals with poorer speech discrimination skills had more difficulty comprehending spoken sentences, immittance measurement and pure tone audiometry did not predict language comprehension.
| Group | ||||||
|---|---|---|---|---|---|---|
| Down Syndrome | Non-Down syndrome Intellectually impaired (comparison group) | |||||
| Time of Assessment | ||||||
| Hearing Measure | Year 1 | Year 2 | Year 3 | Year 1 | Year 2 | Year 3 |
| Air Conduction (Pure Tone Audiometry) | -.071 | -.257 | -.394† | .235 | .179 | .099 |
| Speech Discrimination (Speech Audiometry) | .410* | .580** | .476* | -.040 | -.002 | .076 |
| Acoustic Reflexes (Immittance Measurement) | .163 | -.004 | .353 | -.089 | -.302 | -.204 |
| Note: Values are partial correlations with the effects of chronological age removed. ~ p <.10 * p < .05 ** p < .01 | ||||||
Backward Masking
In the first administration of the backward masking task (see Table 6), partial correlations revealed that Down syndrome individuals with higher (i.e., worse) air conduction thresholds, lower speech discrimination scores, or poorer acoustic reflexes tended to identify fewer items in the 40-msec, but not the 320-msec, masking condition; in contrast, comparison group subjects showed no association between hearing measures and performance on the backward masking task. Tympanogram classification of subjects with Down syndrome (see Table 7) revealed that the bilaterally-impaired subgroup identified significantly fewer words than the other subgroup in only the 40-msec condition. Thus, Down syndrome individuals with poor hearing - regardless of how it was measured - had difficulty identifying spoken words when they were rapidly followed by a noise. However, when the noise came later (and there was more time available to identify the word), Down syndrome individuals with poorer hearing no longer had greater difficulty repeating the word.
| Group | ||||
|---|---|---|---|---|
| Down Syndrome | Non-Down syndrome Intellectually impaired (comparison group) | |||
| Backward Masking Condition | ||||
| Hearing Measure | 40 msec | 320 msec | 40 msec | 320 msec |
| Air Conduction (Pure Tone Audiometry) | -.485* | -.141 | -.150 | -.268 |
| Speech Discrimination (Speech Audiometry) | .407* | .259 | -.022 | .197 |
| Acoustic Reflexes (Immittance Measurement) | .472* | .312 | -.073 | -.027 |
| Note. Values are partial correlations with the effects of chronological age removed. * p < .05 | ||||
| Tympanogram Type | |||||
|---|---|---|---|---|---|
| Normal or Unilateral Impaired | Bilateral Impaired | ||||
| Masking Condition | N | Number Correct (SD) | N | Number Correct (SD) | Result |
| 40 msec | 14 | 5.4 (1.2) | 12 | 4.3 (1.1) | t (24) = 2.38* |
| 320 msec | 14 | 5.9 (0.9) | 12 | 5.0 (1.9) | t (24) = 1.65 |
| Note: The number of words available for identification in each masking condition was 7. The standard deviation is in parentheses next to the mean * p < .025. | |||||
Partial correlations for the second administration of the backward masking task are reported in Table 8. These correlations revealed a similar pattern: Down syndrome individuals with higher air conduction thresholds, lower speech discrimination scores, or fewer acoustic reflexes tended to identify fewer masked words. In contrast, comparison group subjects showed a backward masking relationship with only the speech discrimination measure. Furthermore, the Down syndrome subgroup with bilateral impaired tympanograms (N = 8) identified significantly fewer words (mean = 14.4, SD = 2.5) than the Down syndrome subgroup with normal hearing in one or both ears (N = 15) (mean = 15.9, SD = 1.6), t (21) = 1.82, p < .05. Thus, even when the response was silent pointing, Down syndrome youth with poorer hearing still tended to identify single, rapidly-masked spoken words less accurately than Down syndrome youth with better hearing.
| Hearing Measure | Group | |
|---|---|---|
| Down Syndrome | Non-Down syndrome Intellectually impaired (comparison group) | |
| Air Conduction (Pure Tone Audiometry) | -.410* | -.230 |
| Speech Discrimination (Speech Audiometry) | .552** | .477* |
| Acoustic Reflexes (Immittance Measurement) | .572* | -.213 |
| Note: Values are partial correlations with the effects of chronological age removed. * p < .05 ** p < .01 | ||
Word Identification
In the first administration of the word identification task (see Table 9), Down syndrome subjects with higher air conduction thresholds, lower speech discrimination scores, or fewer acoustic reflexes tended to make more errors in the consonant, but not the vowel, condition; in contrast, comparison group subjects showed no such pattern. Furthermore, the Down syndrome subgroup with bilateral impaired tympanograms (see Table 10) made significantly more errors than other subjects with Down syndrome in the consonant, but not the vowel, condition. These results, obtained with tape recordings of natural speech, suggest that for hearing-impaired subjects with Down syndrome, acoustically-shorter consonant sounds are more difficult to process than acoustically-longer vowel sounds.
| Group | ||||
|---|---|---|---|---|
| Down Syndrome | Non-Down syndrome Intellectually impaired (comparison group) | |||
| Word Identification Condition | ||||
| Hearing Measure | Consonant | Vowel | Consonant | Vowel |
| Air Conduction (Pure Tone Audiometry) | .536* | .269 | .201 | .502* |
| Speech Discrimination (Speech Audiometry) | -.525* | -.265 | -.135 | -.189 |
| Acoustic Reflexes (Immittance Measurement) | -.589* | -.169 | .162 | -.221 |
| Note: Values are partial correlations with the effects of chronological age removed. ** p < .01 | ||||
| Tympanogram Type | |||||
|---|---|---|---|---|---|
| Normal or Unilateral Impaired | Bilateral Impaired | ||||
| Basis of Word Identification | N | Number of Errors (SD) | N | Number of Errors (SD) | Result |
| Consonant | 16 | 1.0 (1.0) | 8 | 2.1 (1.0) | t (22) = 2.67* |
| Vowel | 16 | 1.3 (1.1) | 8 | 1.3 (1.7) | t (22) = 0.11 |
| Note: The number of possible errors in each condition was 8. The standard deviation is in parentheses next to the mean. * p < .01 | |||||
Correlational and categorical results were quite different for the second administration of the word identification task (computer-generated speech): Neither the group with Down syndrome group nor comparison group subjects showed any relationship between hearing ability and performance in the consonant or vowel conditions. An important limitation of this task was that performance in the consonant condition was near chance level in the group with Down syndrome (6.8 errors in a task where 8 errors would occur by guessing alone). The synthetic speech, in contrast to the natural speech used in the first administration of the word identification task, was apparently difficult for Down syndrome subjects with or without hearing difficulties to identify.
Summary and Discussion
The audiological findings of this project were quite straightforward: To paraphrase Wilson et al. (1983), who noted that nearly every part of the auditory system of individuals with Down syndrome is anatomically abnormal, we might add that nearly every auditory response of individuals with Down syndrome, considered as a group, was behaviorally abnormal. The better performance of the same-age, same-IQ comparison group showed that hearing problems are indeed more prevalent in the Down syndrome population and are not a function of poor understanding of test procedures (as might be expected with a low IQ). Because the group with Down syndrome performed more poorly on virtually every measure of hearing, it seems likely that this group experiences some degree of lower sensitivity, poorer resolution, and/or distortion in processing sounds. Specific audiological findings may be summarized as follows:
- Pure tone air conduction thresholds at each frequency (250-8000 Hz) were worse and showed greater decline over time in subjects with Down syndrome than in comparison group subjects. Hearing losses of individuals with Down syndrome were especially prominent at 8000 Hz, perhaps reflecting a progressive sensorineural component and early onset of presbyacusis (Brooks et al., 1972; Buchanan, 1990; Davies, 1985; Widen, Folsom, Thompson, and Wilson, 1987). The possibility of high-frequency sensorineural loss is consistent with our finding of a significantly higher 4000 Hz bone conduction threshold in subjects with Down syndrome than in comparison group subjects. Audiological classification of type of hearing loss revealed more impaired Down syndrome ears (with predominantly conductive and mixed hearing losses), and the overall air-bone gap suggested a larger conductive component in the hearing loss of the subjects with Down syndrome than in comparison group subjects (cf. Balkany, Downs, Jafek, and Krajicek, 1979; Dahle and McCollister, 1986).
- Tympanogram classification revealed more impaired Down syndrome ears (primarily with no mobility, reduced mobility, or retraction of the tympanic membrane). The distribution of Down syndrome ears across different tympanogram categories was similar to that reported by others (e.g., Davies and Penniceard, 1980; Evenhuis et al., 1992; Keiser et al., 1981), and Down syndrome difficulties were typically bilateral and chronic (cf. Davies, 1985). The tympanogram typing was useful in several ways: it was reasonably easy to obtain in our adolescent and young adult samples, objective in interpretation, clearly discriminated the two groups (virtually no comparison group subjects, but about 40% of subjects with Down syndrome, showed abnormal patterns), and provided a reasonable basis for creating clinically meaningful subgroups of subjects with Down syndrome with and without bilateral hearing difficulty. Although the other immittance measurement (acoustic reflexes) consistently revealed Down syndrome auditory system deficiency (Keiser et al., 1981; Schwartz and Schwartz, 1978), this measure was difficult to obtain in some subjects.
- Speech audiometry revealed worse speech reception thresholds and slightly, but significantly, poorer speech discrimination scores for subjects with Down syndrome than comparison group subjects. Speech audiometry tasks were relatively easy to administer in this age group and were perhaps more concrete and motivating for the participants. Speech reception threshold performance closely resembled pure tone air conduction averages, making these measures essentially redundant. The speech discrimination score was particularly robust in that it was the only audiological component to correlate with performance on each of the four auditory-cognitive tasks. It also afforded a reliable single-ear index of the consequences of hearing impairment: speech discrimination scores obtained with impaired Down syndrome ears were lower than those obtained with normal ears, regardless of whether ear classification was made on the basis of audiological or tympanogram typing.
Systematic screening revealed relationships between hearing and auditory-cognitive variables that were durable across different statistical procedures, replicable across years, and present in subjects with Down syndrome but not in comparison group subjects. The following relationships suggest, but by no means demonstrate, that perceptual deficiencies early in the continuum of acoustic processing may subtly constrain or interact with cognitive processes higher in the continuum (e.g., memory, response organization) to depress the cognitive performance of individuals with Down syndrome more than comparison group individuals:
- Individuals with Down syndrome who had either lower speech discrimination scores or poorer acoustic reflexes tended to imitate spoken sentences less accurately. Furthermore, when the group with Down syndrome was subdivided on the basis of tympanogram classification, those subjects with bilateral middle ear difficulties tended to have more difficulty repeating sentences. These findings suggest that there is a consistent relationship between sentence imitation and hearing ability in the population with Down syndrome, and that the usefulness of the tympanogram categorical procedure in identifying individuals with Down syndrome at risk for expressive language difficulty might be explored.
- Individuals with Down syndrome who had lower speech discrimination scores tended to understand fewer sentences in a grammatical language comprehension task, suggesting, perhaps not surprisingly, that the ability to understand isolated words relates to the comprehension of spoken discourse. Although it is unclear why other audiological measures did not correlate with comprehension performance, it should be noted that several similarly complex cognitive tasks -notably auditory-verbal digit span and oral vocabulary - as well as a seemingly simpler cognitive task picture vocabulary - showed no relationship at all to hearing variables. It is also interesting to note that pure tone audiometry measurements of hearing ability failed to predict performance on both imitation and comprehension language tasks.
- Individuals with Down syndrome who had worse hearing (regardless of how it was measured) tended to accurately repeat fewer words when the words were rapidly followed by a masking noise. This pattern, which was also present in the subgroup of Down syndrome individuals with bilaterally abnormal tympanograms, did not tend to appear when words were followed more slowly by a masking noise. Furthermore, these results were replicated when subjects identified a rapidly masked word with a nonverbal pointing response rather than a spoken response. It appears, then, that individuals with Down syndrome who have poorer hearing identify isolated spoken words more slowly than those with better hearing. This outcome was discussed by Marcell and Cohen (1992) in an analysis of the Year 1 data; they suggested that poorer performance by hearing-impaired subjects with Down syndrome on the backward masking task represents a combined effect of low auditory acuity and slow processing speed. Future basic research should determine whether relationships between hearing ability and speed of word processing in Down syndrome individuals also occur in masking tasks with nonverbal auditory stimuli like pure tones. This would help to determine whether the potential speed of processing problem is specific to words or, instead, characteristic of acoustic processing in general. Future applied research might address whether changes in global speech parameters (e.g., intensity, rate) influence identification accuracy of rapidly masked words by Down syndrome youth with hearing impairment.
- Individuals with Down syndrome who had worse hearing (regardless of how it was measured) tended to make more errors identifying spoken words made discriminable by consonant sounds. This pattern, which was also apparent in the subgroup of Down syndrome individuals with bilateral abnormal tympanograms, did not tend to appear when subjects identified words made discriminable by vowel sounds. The results, which were obtained only with human speech and not with synthesized speech, suggest that Down syndrome individuals with poorer hearing have more difficulty correctly perceiving acoustically-shorter consonant sounds than acoustically-longer vowel sounds. Difficulty in discriminating consonant sounds has also been reported for adult aphasics and language-disordered children (e.g., Lubert, 1981) and is consistent with the earlier suggestion that the difficulty associated with Down syndrome on laboratory-based word identification tasks is due to an interaction between the quality of perceptual resolution and speed of processing. As with the backward masking task, future basic research should determine whether individuals with Down syndrome also experience problems in discriminating brief nonverbal acoustic or even visual cues. Research by Tallal and her colleagues (e.g., Tallal, 1980; Tallal and Piercy, 1974) has documented that non-intellectually impaired, language-disordered children have difficulty discriminating rapidly-changing visual and auditory nonverbal as well as verbal stimuli, thus suggesting a more global and central source of difficulty. Likewise, future applied research might determine whether changes in internal speech parameters (e.g., enhancing the discriminability of a stop consonant) influence word identification accuracy of hearing-impaired youth with Down syndrome.
Several caveats should be made when considering implications of the correlational findings reported in this study. First, because this is relational research, it is important to remember that unmeasured variables, such as low socioeconomic status and its manifest educational and health-related outcomes, may actually be responsible for the causal links between poor performance on hearing and auditory-cognitive tasks. Second, one should not fall into the trap of taking a completely "bottom-up" perspective in which poor cognitive performance is thought to be determined by the deficient quality of earlier acoustic perception. Although it is quite reasonable to assume that hearing ability to some degree constrains higher auditory processing, it must be remembered that natural speech is typically redundant and embedded in a rich context with multiple situational and gestural cues for understanding. Furthermore, as McAdams (1993) has noted, part of our understanding of the world of sound is shaped by "top-down" processes - experience, intelligence, motivation, effort, insight - which help us to interpret acoustic input, particularly when it is ambiguous. Third, in light of the speech stimuli presented and verbal responses required in most of the tasks of this study, it should be remembered that individuals with Down syndrome often enter language situations with other handicaps that may contribute to their poor performance. For example, they are less able to hold auditory-verbal items in short-term memory (Marcell, Harvey, and Cothran, 1988; Marcell and Weeks, 1988), respond more slowly to auditory stimuli (Davis, Sparrow, and Ward, 1991), and express themselves less effectively (Dodd, 1976; Miller, 1987). Thus, in addition to perceptually processing auditory stimuli more poorly, it is likely that many individuals with Down syndrome will also remember the information less well, organize their responses more slowly, and speak less clearly. Finally, it is important to note that the performance of comparison group participants on the audiological assessment (particularly the immittance measurement component) was not as variable as that of the group with Down syndrome. Thus, the absence of relationships between audiological and auditory-cognitive measures in the comparison group may have been a function of a restricted range of performance on audiological tasks. Although it is clear that the group with Down syndrome differed from the IQ- and CA-matched comparison group on both audiological and auditory-cognitive tasks, and that relationships between these variables exist in the population with Down syndrome, it is possible that the presence of a comparison group matched on hearing abilities might yield a different pattern of correlational results for that group.
In conclusion, hearing difficulties in the realms of pure tone audiometry, immittance measurement, and speech audiometry repeatedly emerged in a group of adolescents and young adults with Down syndrome, but not in a matched group of intellectually disabled peers. Furthermore, Down syndrome youth with hearing difficulties performed more poorly in the auditory-cognitive realms of sentence imitation, language comprehension, speed of word processing, and sensitivity to brief acoustic cues. Because relationships between hearing and cognitive variables were not present in the intellectually impaired comparison group, it may be tentatively suggested that hearing difficulty interacts with etiology; i.e., hearing loss appears to be more detrimental to certain cognitive abilities in intellectually impaired individuals with Down syndrome. Such a suggestion is only tentative, though, and would be strengthened by the testing of a non-Down syndrome intellectually impaired comparison group that has a range of hearing impairments similar to that of Down syndrome individuals.
Footnote 1
A similar set of correlational analyses conducted for Year 1 of this project by Marcell and Cohen (1992) failed to reveal an association between sentence imitation and hearing ability. The results reported here, however, differ in two important ways. First, whereas Marcell and Cohen (1992) used SRT to represent the speech audiometry assessment, a better case can be made for the use of speech discrimination as a representative measure because of the high correlations between SRT and pure tone air conduction. Second, whereas Marcell and Cohen (1992) used a less sensitive scoring procedure for the sentence imitation task (1 point for each sentence repeated correctly), a better case can be made for the use of a scoring procedure (1 point for each correctly recalled word in a sentence) that is not as susceptible to restriction of range.
Author's Note and Acknowledgements
This manuscript is an expanded and reorganized version of a paper presented at the London symposium, "Medical Issues in Down Syndrome: Consensus and Controversy", sponsored by the Royal Society of Medicine and the Down Syndrome Association in June of 1994, and subsequently published in 1995 as a chapter in the book, Medical Issues in Down Syndrome (J. Dennis and L. Marder, editors). Financial support for this research was provided by an Academic Research Enhancement Award (HD25793) from the National Institute of Child Health and Human Development. Thanks are extended to the following individuals for their help in collecting cognitive data across the three years of the project: Emily Ann Busby, Pamela S. Croen, Joanne K. Mansker, Amy E. Powell, Melissa M. Ridgeway, David H. Sewell, Tammy D. Sizemore, Debby S. West, and Melanie L. Whelan. Thanks are also extended to the staff of the Charleston Speech and Hearing Center, and particularly to Stuart Cohen and Douglas Cameron, for the collection of audiological data.
References
- Balkany, T.J., Downs, M.P., Jafek, B.W. and Krajicek, M.J. (1979). Hearing loss in Down syndrome: A treatable handicap more common than generally recognized. Clinical Pediatrics, 18, 116-118.
- Brooks, D.N., Wooley, H. and Kanjilal, G.C. (1972). Hearing loss and middle ear disorders in patients with Down Syndrome (Mongolism). Journal of Mental Deficiency Research, 16, 21-29.
- Buchanan, L.H. (1990). Early onset of presbyacusis in Down syndrome. Scandinavian Audiology, 19, 103-110.
- Christensen, L.B. (1988). Experimental Methodology. Boston: Allyn and Bacon.
- Coren, S. (1989). Summarizing pure-tone hearing thresholds: The equipollence of components of the audiogram. Bulletin of the Psychonomic Society, 27, 42-44.
- Cunningham, C. and McArthur, K. (1981). Hearing loss and treatment in young Down syndrome children. Child: Care, Health and Development, 7, 357-374.
- Dahle, A.J. and McCollister, F.P. (1986). Hearing and otologic disorders in children with Down syndrome. American Journal of Mental Deficiency, 90, 636-642.
- Davies, B. (1985). Hearing problems. In D. Lane and B. Stratford (eds.), Current approaches to Down Syndrome (pp. 85-102). London: Praeger.
- Davies, B. and Penniceard, R.M. (1980). Auditory function and receptive vocabulary in Down Syndrome children. In I.G. Taylor and A. Markides (eds.), Disorders of Auditory Function III (pp. 51-58). London: Academic Press.
- Davis, W.E., Sparrow, W.A. and Ward, T. (1991). Fractionated reaction times and movement times of Down syndrome and other adults with mental retardation. Adapted Physical Activity Quarterly, 8, 221-233.
- Dodd, B. (1976). A comparison of the phonological systems of mental age matched, normal, severely subnormal and Down syndrome children. British Journal of Disorders of Communication, 11, 27-42.
- Downs, M.P. (1983). Is there hearing help for Down Syndrome? In G.T. Mencher and S.E. Gerber (eds.), The Multiply Handicapped Hearing Impaired Child (pp. 301-316). New York: Grune and Stratton.
- Evenhuis, H.M., van Zanten, G.A., Brocaar, M.P. and Roerdinkholder, W.H.M. (1992) . Hearing loss in middle-age persons with Down syndrome. American Journal on Mental Retardation, 97, 47-56.
- Van Gorp, E., and Baker, R. (1984). The incidence of hearing impairment in a sample of Down syndrome schoolchildren. International Journal of Rehabilitation Research, 7, 198-200.
- Keiser, H., Montague, J., Wold, D., Maune, S. and Pattison, D. (1981). Hearing loss of Down syndrome adults. American Journal of Mental Deficiency, 85, 467-472.
- Libb, J.W., Dahle, A., Smith, K., McCollister, F.P. and McLain, C. (1985). Hearing disorder and cognitive function of individuals with Down syndrome. American Journal of Mental Deficiency, 90, 353-356.
- Lonigan, C.J., Fischel, J.E., Whitehurst, G.J., Arnold, D.S. and Valdez-Menchaca, M.C. (1992) . The role of otitis media in the development of expressive language disorder. Developmental Psychology, 28, 430-440.
- Lubert, N. (1981). Auditory perceptual impairments in children with specific language disorders: A review of the literature. Journal of Speech and Hearing Disorders, 46, 3-9.
- Marcell, M.M. and Cohen, S. (1992). Hearing abilities of Down syndrome and other intellectually impaired adolescents. Research in Developmental Disabilities, 13, 533-551.
- Marcell, M.M., Croen, P.S., Mansker, J.K. and Sizemore, T.D. (1994, April). Language comprehension by Down syndrome and other intellectually impaired youth. Paper presented at the International Down Syndrome Conference, Charleston, South Carolina.
- Marcell, M.M., Croen, P.S. and Sewell, D.H. (1991, April). Spoken word identification by Down syndrome and other intellectually impaired adolescents. Paper presented at the biennial meeting of the Society for Research in Child Development, Seattle.
- Marcell, M.M., Harvey, C.F. and Cothran, L.P. (1988). An attempt to improve auditory short-term memory in Down syndrome individuals through reducing distractions. Research in Developmental Disabilities, 9, 405417.
- Marcell, M.M., Ridgeway, M.M., Sewell, D.H. and Whelan, M.L. (1995). Sentence imitation by adolescents and young adults with Down syndrome and other intellectual disabilities. Journal of Intellectual Disability Research, 39, 215-232.
- Marcell, M.M., Sizemore, T.D., Mansker, J.K., Busby, E.A., Powell, A.E., Ridgeway, M.M., West, D.S. and Whelan, M.L. (1992, August). Discrimination of consonant and vowel sounds by Down syndrome individuals . Paper presented at the annual meeting of the American Psychological Association, Washington, D.C.
- Marcell, M.M. and Weeks, S.L. (1988). Short-term memory difficulties and Down syndrome. Journal of Mental Deficiency Research, 32, 153-162.
- McAdams, S. (1993). Recognition of sound sources and events. In S. McAdams and E. Bigand (Eds.), Thinking in Sound: The Cognitive Psychology of Human Audition (pp. 146-198). Oxford: Clarendon Press.
- Miller, J.F. (1987). Language and communication characteristics of children with Down syndrome. In S.M. Pueschel, C. Tingey, J.E. Rynders, A.C. Crocker and D.M. Crutcher (Eds.), New Perspectives on Down Syndrome (pp. 233-262). Baltimore: Brookes.
- Miller, J.F. and Yoder, D.E. (1984). Miller-Yoder Language Comprehension Test (clinical edition). Baltimore: University Park Press.
- Needleman, H. (1977). Effects of hearing loss from early recurrent otitis media on speech and language development. In B.F. Jaffe (Ed.), Hearing Loss in Children: A Comprehensive Text (pp. 640-649). Baltimore: University Park Press.
- Nolan, M., McCartney, E., McArthur, K. and Rowson, V.J. (1980). A study of the hearing and receptive vocabulary of the trainees of an adult training centre. Journal of Mental Deficiency Research, 24, 271-286.
- Paden, E.P., Novak, M.A. and Beiter, A.L. (1987). Predictors of phonologic inadequacy in young children prone to otitis media. Journal of Speech and Hearing Disorders, 52, 232-242.
- Paul, P.V. and Quigley, S.P. (1987). Some effects of early hearing impairment on English language development. In F.N. Martin (ed.), Hearing Disorders in Children (pp. 49-80). Austin, TX: Pro-Ed.
- Reed, M.A. (1989). Speech perception and the discrimination of brief auditory cues in reading disabled children. Journal of Experimental Child Psychology, 48, 270-292.
- Schwartz, D.M. and Schwartz, R.H. (1978). Acoustic impedance and otoscopic findings in young children with Down Syndrome. Archives of Otolaryngology, 104, 652-656.
- Siegel, S. and Castellan, N.J. (1988). Nonparametric Statistics for the Behavioral Sciences. New York: McGraw-Hill.
- Silva, P.A., Kirkland, C., Simpson, A., Stewart, I.A. and Williams, S.M. (1986) . Some developmental and behavioral problems associated with bilateral otitis media with effusion. Journal of Learning Disabilities, 15, 417-421.
- Tabachnick, B.G. and Fidell, L.S. (1989). Using Multivariate Statistics. New York: Harper and Row.
- Tallal, P. (1980). Perceptual requisites for language. In R.L. Schiefelbusch (Ed.), Language Intervention Series Volume IV: Nonspeech Language and Communication Analysis and Intervention (pp. 449-467). Baltimore: University Park Press.
- Tallal, P. and Piercy, M. (1974). Developmental aphasia: Rate of auditory processing and selective impairment of consonant perception. Neuropsychologia, 12, 83-93.
- Teele, D.W., Klein, J.O. and Rosner, B.A. (1984). Otitis media with effusion during the first three years of life and development of speech and language. Pediatrics, 74, 282-287.
- Tucker, I. and Nolan, M. (1986). Methods of objective assessment of auditory function in subjects with limited communication skills. In D. Ellis (Ed.), Sensory Impairments in Intellectually Impaired People (pp. 218-238). London: Croom Helm.
- Whiteman, B.C., Simpson, G.B. and Compton, W.C. (1986). Relationship of otitis media and language impairment in adolescents with Down syndrome. Mental Retardation, 24, 353-356.
- Widen, J.E., Folsom, R.C., Thompson, G. and Wilson, W.R. (1987). Auditory brainstem responses in young adults with Down syndrome. American Journal of Mental Deficiency, 91, 472-479.
- Wilson, W.R., Folsom, R.C. and Widen, J.E. (1983). Hearing impairment in Down syndrome children. In G.T. Mencher and S.E. Gerber (Eds.), The Multiply Handicapped Hearing Impaired Child (pp. 259-299). New York: Grune and Stratton.
- Zinkus, P.W., Gottlieb, M.I. and Schapiro, M. (1978). Developmental and psychoeducational sequelae of chronic otitis media. American Journal of Disabilities in Childhood, 132, 1100-1104.

